In the game show “The Price Is Right,” contestants guess the retail price of fabulous prizes. Unlike many guessing games where you try to make the best possible guess, the contestant who guesses the number closest to the actual price—without going over—wins. Contestants have to resist the inclination to make the most accurate guess without going over the actual value.
Experts have argued that macroeconomic management has a similar dynamic. In a recent blog post, Alex Domash and Larry Summers argue that high wage growth can sometimes leave workers less well off. Rising wages are, after all, going to be associated with other price increases. They explain that wage growth is related to increased real wages (wages adjusted for inflation—compared to “nominal wages,” which are the simple dollar amount). However, after a certain threshold, that relationship reverses. When nominal wages are very high, that is associated with lower real wages—likely due to adverse supply shocks or overly too-stimulative aggregate demand. Like contestants on “The Price Is Right” macroeconomic policymakers need to be careful in placing policy over the optimal amount.
This is not just an academic argument—it has relevance to policy debates in both the past and present. For example, a common criticism of the Obama administration (and by extension, Summers’ tenure at the National Economic Council) is that the United States never reached full employment. Current employment-to-population levels (despite the claimed “worker shortage”) are currently higher than in the Obama administration. On the other hand, some have argued that rising employment levels, and wages may be fueling inflation and called on fiscal and monetary policymakers to take drastic measures to reduce inflation even at the cost of increased unemployment.
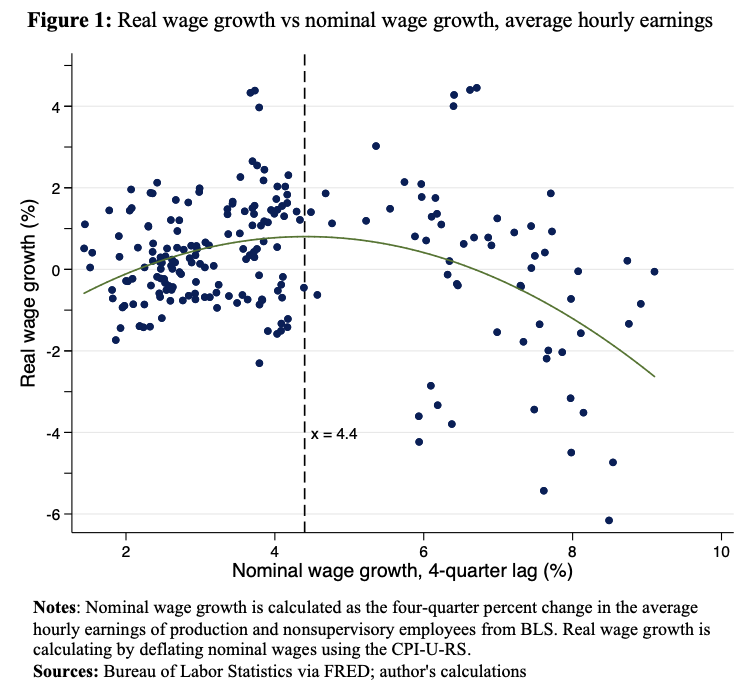
Domash and Summers’ argument suggests that policymakers should be more cautious about pushing wages up—if they go too far, it could result in real wages falling. The graph below illustrates this finding. There is a positive correlation between real wage growth and the previous year’s nominal wage growth until nominal wage growth goes above 4.4 percent. After that, further increases are likely to be negated by inflation rising faster, resulting in a drop in the real wage.
Analyses of this type require people to decide how to generate or present their data. While there is nothing incorrect in how Domash and Summers displayed their findings, small changes can lead to a very different result. Three small changes outlined below result in a different finding, with contrasting policy implications.
Change #1: Lose the polynomial fit
Domash and Summers use a “polynomial fit” to estimate the relationship between nominal wages and real wages. You might remember a high school algebra class where you had to solve equations of the form “ax2 + bx + c”. A polynomial fit finds the values of “a” “b” and “c” that best approximate the data.
A polynomial fit could be appropriate because of the hypothesized reversing relationship between nominal and real wage increases. It allows us to find the local maximum without necessarily assuming one. If a more conventional linear fit is more accurate, the value for “a” should be very close to zero. In such cases, the equation effectively becomes “bx + c”.
An alternative to the Domash and Summers analysis is to conduct two separate linear regressions, one on either side of their proposed cut-off. The graph below shows these regressions in red and the original polynomial fit in green.
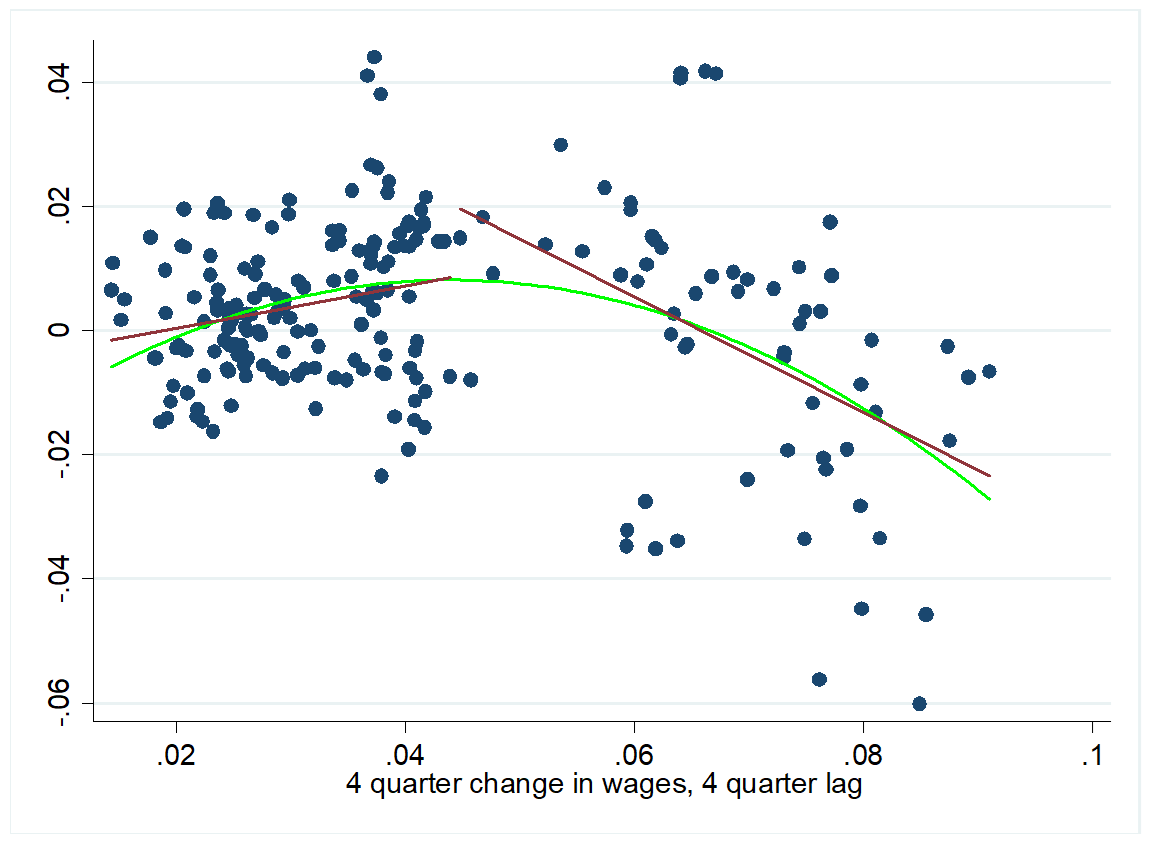
This change reveals that their essential result of a changing slope after passing the 4.4 percent wage growth line is preserved. We move from a gentle upward slope of 0.34 to a strongly negative slope of -0.93. Another advantage of this alternative framework is it allows us to conduct statistical tests that the slope change is statistically significant (p<0.001). Looking at the graph using two separate linear regressions does not change the interpretation of their initial findings. Still, it will make some of the larger changes I make later easier to interpret.
Change #2: Look at years instead of quarters
A second change we make is to disaggregate the data. Domash and Summers’ analysis is indexed at the quarter level. There is an observation for nominal wage growth in Fall 1994, Winter 1994, and Spring 1995. But since we are looking at the change over four quarters, every observation has substantial amounts of information that are incorporated into the previous observation. A data point from Summer 1994 incorporates whatever changes that happened in Summer 1993, Fall 1993, Winter 1993, and Spring 1994. Meanwhile, a data point from Fall 1994 will include changes from Fall 1993, Winter 1993, Spring 1994, and Summer 1994. Three-quarters of the period overlap.

This overlap means that the graph actually has less data than it appears to possess. We see a dense scatter plot with 224 observations, but a better representation would be to look at one data point for every single year. For example, the graph below only includes the first quarter of each year, such that we have 56 observations.
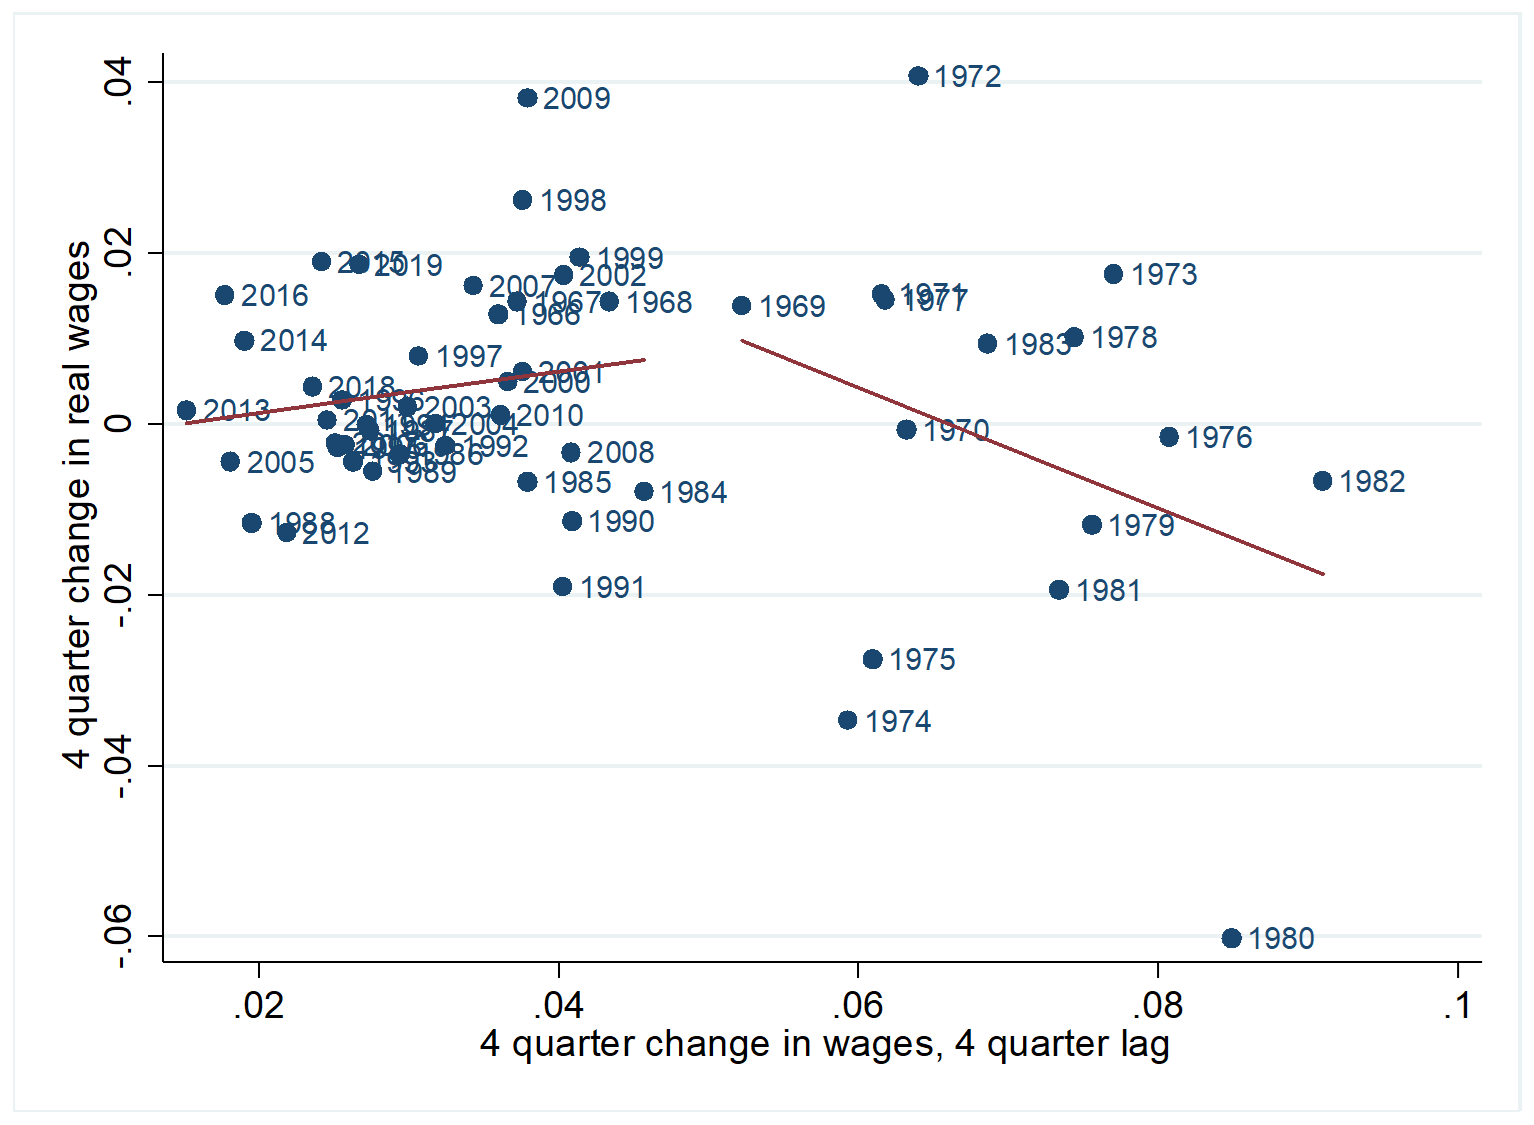
The slope of the second line in this specification is no longer statistically significant. This is not because the change made above has reduced the slope of the line, but because we are looking at fewer observations. Fewer observations have reduced the statistical power of the analysis such that we are less likely to see the statistical significance. Eliminating these observations is a more appropriate way to look at this data—each observation in this specification is new instead of drawing from overlapping dates.
Change #3 – Sensitivity testing
Finally, the previous specification suggests that the year 1980 is an important driver of our results. The earlier iterations of the graph show four points in the bottom right corner. But these are all from a relatively short period—from October 1979 to July 1980.
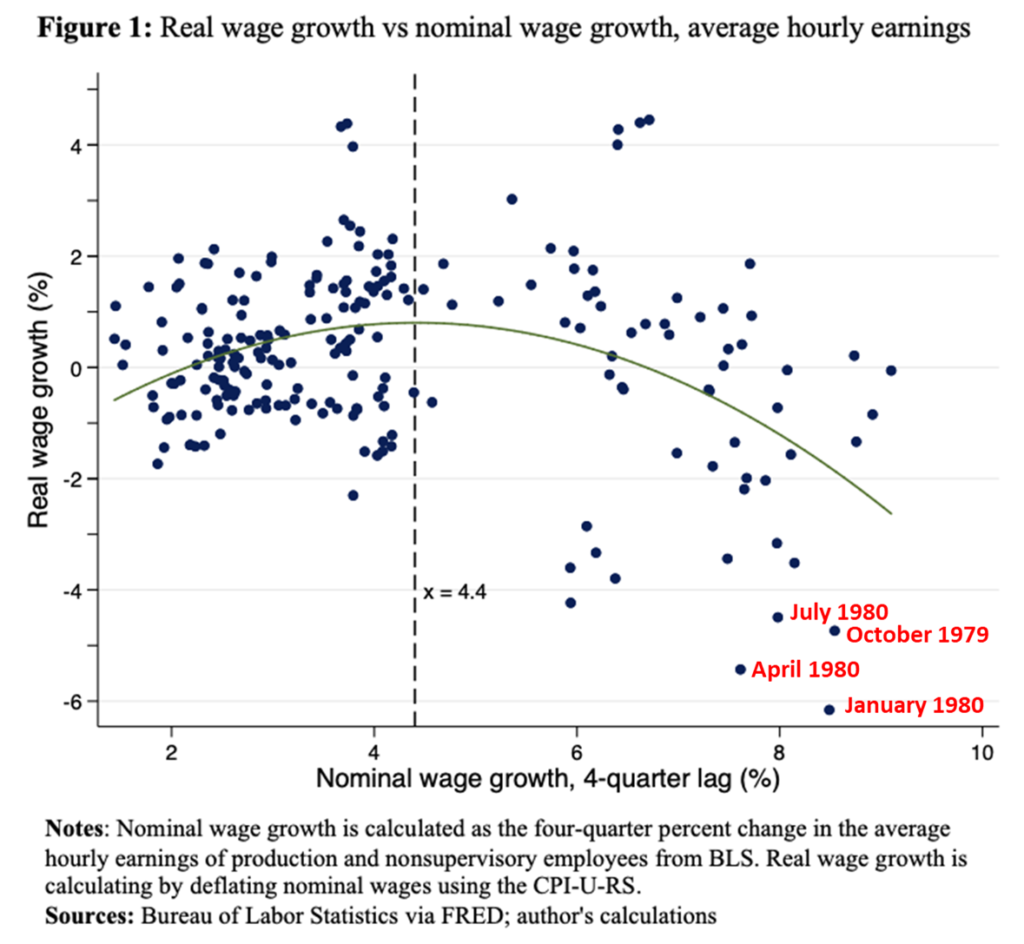
1979 and 1980 are the “Volcker Shock” years and have a special place in macroeconomic history. The Federal Reserve, then led by Paul Volcker, announced a new framework for monetary policy in Fall 1979 and raised interest rates substantially over the next year. Tightening monetary policy led to two consecutive recessions—but also a large decrease in inflation—from a 13.5 percent annual increase in prices in 1980 to a 3.1 percent increase in 1983. As my colleague Ed Dolan has argued, the Volcker Shock was a regime change in monetary policy—not reflecting the Federal Reserve reacting to changing conditions, but a policy change that resulted in different inflation expectations.
These four points are unusual in the data construction. Each point reports changes in real wages after the Volcker shock, with changes in nominal wages that occurred before them. A specific quirk of how the data is being presented—looking at wage growth over a four-quarter period and lagging nominal growth by the same four quarters, allows this to happen.
Because of the uniqueness of the Volcker shock, it’s worth considering what the relationship looks like if we ignore these data points. Re-doing our previous linear regressions, but excluding 1980, we see that the relationship between real and nominal wages is now flat after the 4.4 percent threshold. The negative relationship we had observed previously was entirely due to the Volcker shock alone.
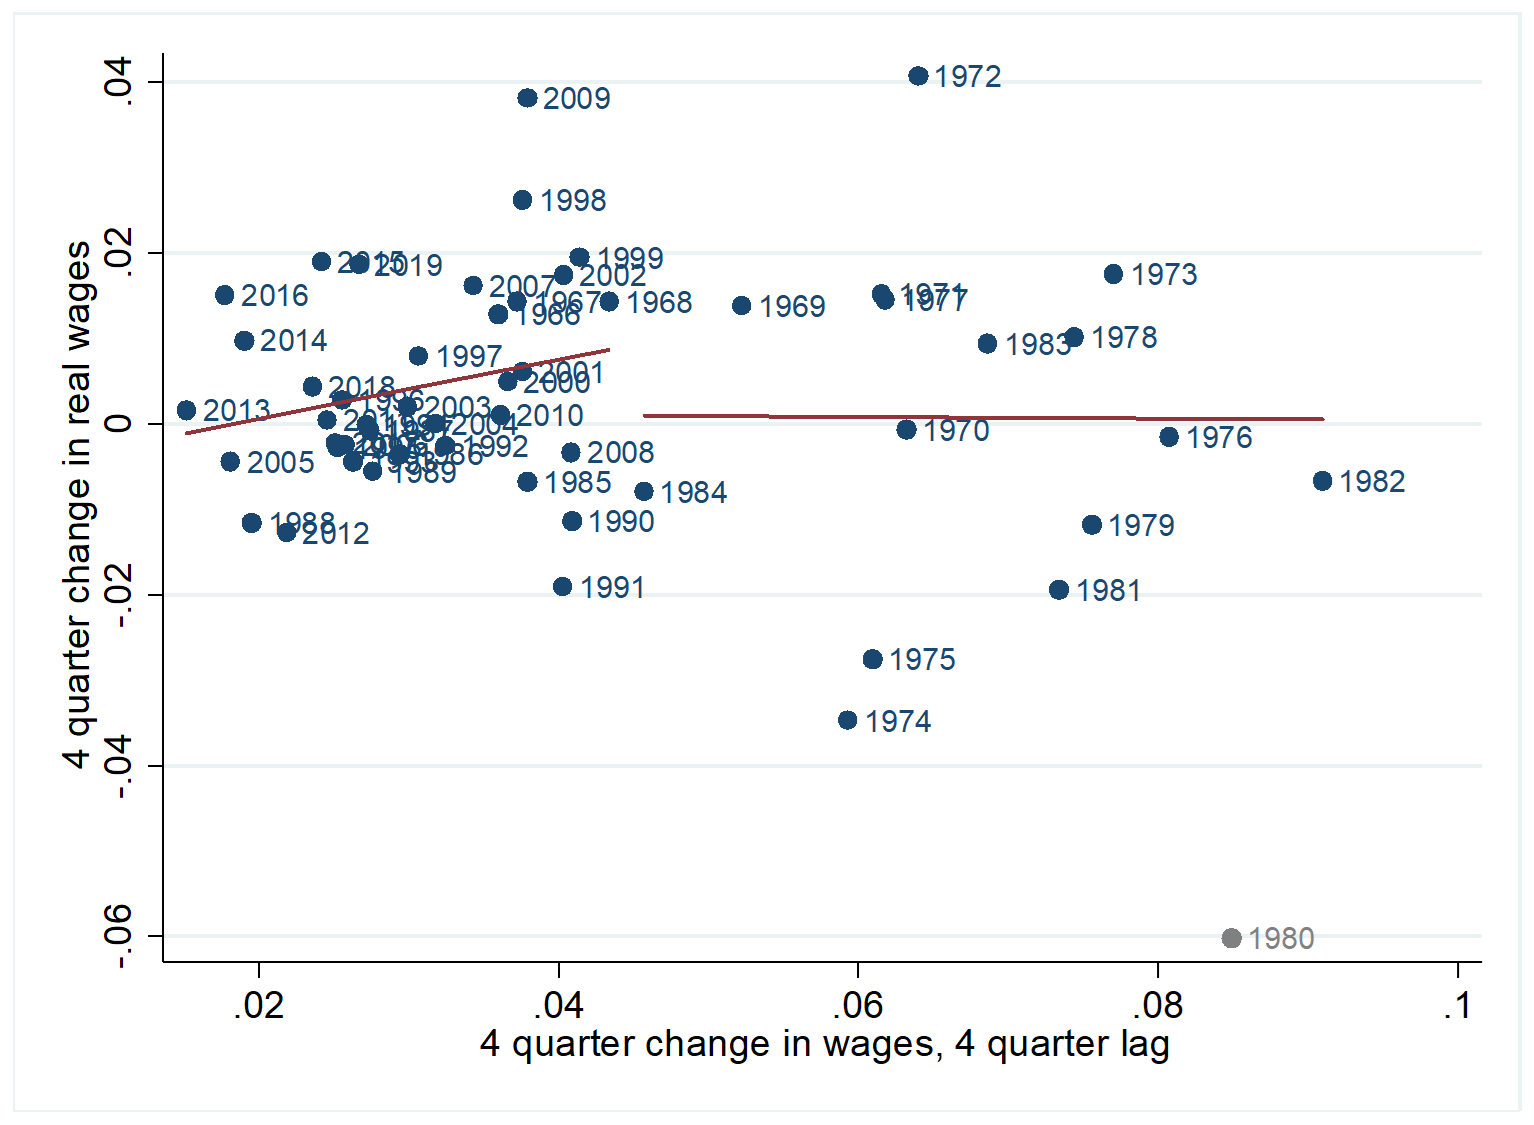
The intention here is not to suggest that the inclusion of 1980 data is inappropriate, only to show that the proposed relationship depends entirely on a single data point. This graph suggests an alternative relationship to the one Domash and Summers proposed. Instead of real wages first rising with nominal wages, then falling, we can suggest a relationship where, under most circumstances, the association is initially positive but then flat.
This interpretation makes microeconomic sense. Wage growth increases until the labor market reaches full employment—which appears to be consistent with aggregate wage growth of around 4.4 percent.
Further growth does not lead to higher real wages, but it does not lead to falling real wages. People’s wages are a function of their productivity (among other factors), which will be priced in real terms. Wages do not rise instantaneously in response to price changes but will adjust over a sufficient period.
Domash and Summers present their results as a cautionary tale: they warn that it is unlikely the Federal Reserve will pull off a “soft landing”—restraining inflation without a corresponding increase in unemployment.
They may be right. But we should be careful in overgeneralizing from the limited sample of data we have. While today may be analogous to the high inflation period that preceded the Volcker shock, it might not be. Yes, it will be difficult for the Federal Reserve to reduce inflation without inducing a recession. While Bob Barker could simply tell a “Price Is Right” contestant to “come on down”, the Federal Reserve has to take actions to reduce inflation. But in taking those actions they should be aware of how little data we are relying on and how hard it is to connect it with our current unprecedented circumstances.
Photo Credit: iStock