
Gallup released today the latest iteration of the longest running survey of the public’s views on immigration in the United States. The poll provides a strong rebuke to voices on and off Capitol Hill agitating for lowering legal immigration on the grounds that Americans are fed up with the current system.
Since 1965 Gallup has asked Americans whether immigration should be kept at its present level, increased, or decreased. In the 1990s, support for further restriction peaked at 65 percent before falling dramatically (for the full historical trends, see here). This year it reached the lowest level, 34 percent, of any point since 1965.
Meanwhile, opposition to cuts—support for increasing the level or keeping it the same—hit 65 percent this year, the highest amount of support for at least the current level of immigration since the poll was taken.
As I described in my recent study on the public’s views on immigration, the Gallup poll is confirmed by three other major surveys—General Social Survey, National Election Studies, and New York Times-CBS—that ask nearly identical versions of this question. All four of these long-running polls document the rapid decline in support for legal immigration reductions since the 1990s, and all find majority opposition to reducing the current level.
While Gallup finds only 25 percent of the public advocates for a general increase in immigration, this is the second highest level on record and three times the average support from the 1960s through 2000. More importantly, as I note in my study, Americans do favor immigration increases if the focus is on legal immigrant workers. I conducted the only comprehensive survey of all polls on the specific question of legal immigrant workers, 45 polls from 2001 to 2014, and found that:
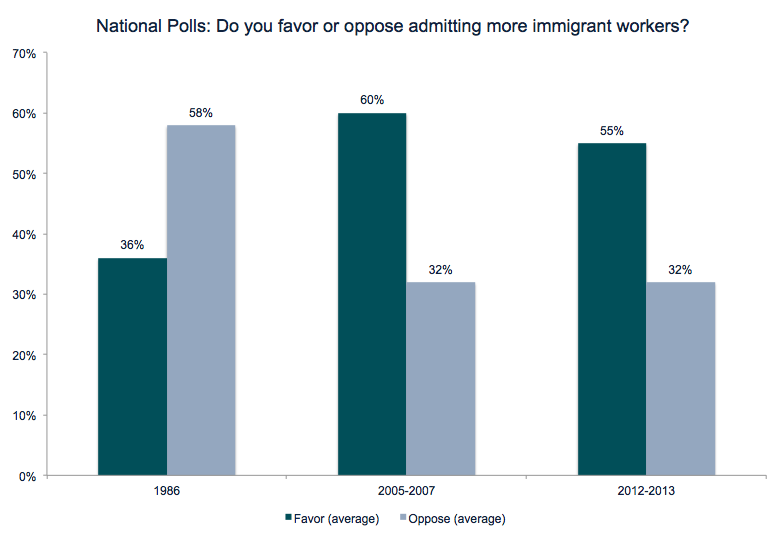
- From 2001 to 2014, the public supported legal immigrant workers on average, 56-34 percent.
- During this time, 60 percent of Republicans and 64 percent of Democrats favored more migrant workers.
This is also a major reversal of public opinion, as seen in the graph below.
The Gallup poll only adds to the evidence that Congress should ignore calls for further restricting the immigration system and focus on fixing it.
Update: A piece at Red Alert Politics argues that this poll from America’s oldest and largest polling firm “shouldn’t be taken seriously” due to its unrepresentative sample sizes based on race and ethnicity. But as the Gallup’s site notes, “Gallup also weights its final samples to match the U.S. population according to gender, age, race, Hispanic ethnicity, education, region, population density, and phone status.”


