On Tuesday, the Bureau of Labor Statistics released data showing that its headline rate of inflation remained over 5 percent for the third straight month. Pundits in the conservative media have been raising the alarm about inflation for most of this year. They see 5 percent as shockingly high. We are in for a rerun of the inflationary 1970s, they warn. Only austerity can save us! Stop the Democrats’ multi-trillion-dollar spending madness before it is too late!
Are these warnings justified? A closer look at the numbers suggests they are not.
The following chart shows not one but four inflation rates. One is the scary 5 percent rate preferred by the pundits. The other three, which are a good deal less alarming, give a better picture of what is really going on.
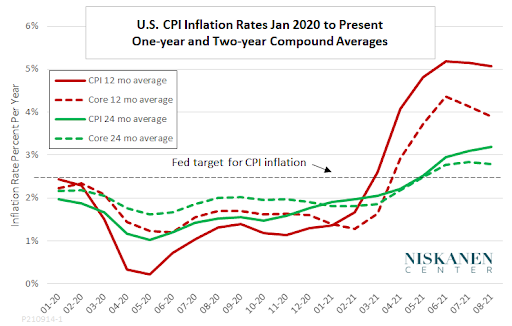
The solid red line in the chart shows the pundits’ favorite, which is the percentage increase in the CPI over the preceding 12 months. However, it turns out that a large part of the surge in that series reflects a rebound from abnormally low levels of inflation in the early months of the pandemic. Economists call that a “base effect.” A simple way to correct for the base effect is to compare each month’s CPI with its value 24 months previously, that is, before the pandemic began. The annualized 24-month inflation rate for the CPI is shown in the chart by the solid green line. It indicates much less of a surge in inflation since the beginning of 2021.
Another useful way of extracting inflation trends from the statistical noise is to look at core inflation, which removes the effect of volatile food and energy prices. The dotted lines in the graph show the 12-month (red) and 24-month (green) trends in the core CPI. Not surprisingly, those series show more moderate ups and downs over the past two years.
The Fed is keeping a close eye on these developments, as it should be. Over the long term, it aims to maintain an inflation rate of around 2 percent per year for an inflation measure called the PCE deflator. The Fed does not treat that target as a ceiling. Rather, it considers it acceptable for inflation to exceed the target for some time after a period during which it has consistently fallen short. August data for the PCE deflator will not be released until October, but we can get an idea of what the Fed will be watching by restating its inflation target in terms of the CPI. For arcane statistical reasons, inflation as measured by the CPI tends to run about half a percentage point ahead of the PCE deflator, so the effective inflation target is shown as 2.5 percent in the chart.
Taking all this into account, then, is there anything especially alarming in current inflation trends? No, not after adjustment for the base effect and the short-term volatility of food and energy prices. Should the Fed continue to monitor inflation closely? Of course–that’s its job. But the pundits who call for austerity to ward off runaway inflation are just blowing smoke.
For a more detailed look at the differences between inflation in the 2020s and inflation in the 1970s, see “Is the Phillips Curve Back? When Should We Start to Worry About Inflation?”