
Key takeaways
- At more than $21 billion annually, Medicare’s Graduate Medical Education (GME) payments are the federal government’s single largest investment in physician training, but the nearly 40-year-old formula for determining payments has not been meaningfully adjusted to address the growing mismatch between where doctors are needed and where they practice.
- The current GME formula systematically disadvantages rural and small programs, depresses primary care training, and locks in a geographic distribution of residency slots disconnected from where physicians are needed most.
- Reforming the formula, not simply adding more slots, is the most direct path to building the physician workforce Americans need. This paper offers Congress actionable options to turn GME funding into a real tool to modernize and strengthen the physician workforce to meet rising demand for medical care.
Introduction
America has a doctor supply crisis — on the whole, the shortage of doctors could climb to 86,000 over the next 10 years.1 But the shortage does not manifest evenly across physician specialties and regions. Rural states and other underserved areas struggle to attract and retain physicians, including critical specialties such as primary care and psychiatry.
If people in underserved areas were to use healthcare at levels similar to their fellow citizens in suburban and more affluent areas, the shortage could well exceed 100,000 doctors, according to projections from the Association of American Medical Colleges.2 Yet this is not because fewer people are interested in careers in medicine. It is the result of a series of deliberate policy decisions that constrained physician supply at precisely the wrong moment.
Our current distribution and training investments are not meeting people’s needs because they are not offering the right financial incentives to attract licensed professionals to underserved areas. Around 20 percent of Americans live in rural areas, yet only 9 percent of physicians practice in them.3 Between 2017 and 2023, rural areas experienced an 11 percent net loss of family physicians.4 Much of the problem derives from uneven distribution of medical residency slots. But where those slots are located and which specialties they train also affect patients’ access to medical care. Among the most concerning trends: 42 percent of doctors are over the age of 55, and rural doctors are, on average, a year older than their urban counterparts.5 The looming retirements will hit rural communities hardest.
Among the incentives shaping the distribution of residency slots, one of the most significant is also one of the most overlooked: Medicare’s Graduate Medical Education (GME) subsidy payments. As the largest funder of medical residency slots, GME subsidies are an important tool in determining whether we have enough doctors where they’re most needed.
Medicare’s GME payments were never designed to shape the physician workforce. Rather, they were meant to reimburse hospitals for the costs of training residents. But over the past six decades since GME’s inception, the reimbursements have grown into the federal government’s single most important lever on where doctors train, what specialties they enter, and ultimately where they practice. Yet this lever has never been deliberately pulled to close the gaps in care that patients face, or to more accurately reflect the cost of training residents. Instead, GME funding has functioned as a passive subsidy that follows and amplifies existing patterns in the healthcare system: concentrating dollars in legacy institutions in the Northeast, rewarding high-cost inpatient procedures, and compounding the advantages of large, established programs over smaller ones. The result is a formula that accelerates the trends driving America’s physician shortage rather than counteracting them.
Congress has meaningful tools to fix these structural problems. By modernizing the formula by which residency training payments are calculated and where they flow, Congress can realign healthcare delivery with healthcare need. This paper outlines four ways that targeted reforms can do that work:
- updating the payment formula to better reflect modern patterns of care delivery
- redirecting dollars toward states with the greatest physician shortages
- strengthening financial incentives for primary care training
- removing the barriers that prevent smaller and rural hospitals from starting and expanding programs
With these targeted, structural reforms, GME funding can be redirected from a passive passenger into an active tool for building the physician workforce patients actually need.
A shortage by design
The physician shortage has identifiable policy roots. In the early 1980s, a federal panel known as the GME National Advisory Committee warned that the United States was approaching a major physician surplus that would inflate healthcare spending.6 Not only did the surplus never materialize, but the panel’s recommendations contributed to the shrinking of the physician pool as medical schools responded to the warning by freezing enrollments for the quarter of a century between 1980 and 2005, reducing the number of physicians entering residency programs.7 Congress also responded, capping Medicare GME-funded residency slots in 1997.8 These moves coincided with a broader skepticism toward government during the 1980s, resulting in a retrenchment of federal support for investment in the health system.9 Moreover, the shrinking supply of physicians came just as demand began to spike thanks to population growth, aging, and an expansion of insurance coverage to more people.
Despite the deepening physician shortage, Congress’s cap on Medicare GME-funded residency slots remains largely in place today, nearly 30 years later. It’s not as if fewer people are interested in medical careers or have failed to satisfy the requirements for a residency program; last year, over 9,500 medical graduates were unable to be matched to a residency program solely because of the limited number of slots.10 Understanding how these shortages have persisted, and where they are concentrated, requires a closer look at how the federal government funds physician training.
Begun in 1965 as part of the Medicare program, GME payments were initially intended as temporary support to help residency programs cover the costs of training physicians. Congress’s goal was to ensure that new Medicare beneficiaries would have access to high-quality doctors. Sixty years later, Medicare is now the largest single funder of residency slots in the United States, providing more than $21 billion to fund residency slots in 2023.
GME funding is divided into two components: Direct Medical Education (DGME) funding, which covers direct residency expenses related to training; and Indirect Medical Education (IME) funding, which aims to compensate hospitals for the indirect costs associated with residency training programs and treating patients whose cases are especially complex. IME funding is significantly larger, representing about 71 percent of total residency funding, or $15 billion in FY2023,11 and accounts for approximately 6 percent of teaching hospitals’ combined fee-for-service inpatient and outpatient revenue.12
Indirect Medical Education (IME)
IME payments are structured as a percentage add-on to each Medicare Inpatient Prospective Payment System (IPPS) discharge payment. The add-on percentage is determined by a hospital’s ratio of full-time equivalent (FTE) residents to inpatient beds, such that hospitals with higher resident-to-bed ratios receive a larger percentage increase on each discharge payment.13 Because IME is an adjustment to IPPS payments, it applies exclusively to inpatient services — outpatient encounters do not generate IME revenue. A hospital’s total annual IME payment is therefore a function of three factors: its resident-to-bed ratio, the volume of its Medicare inpatient discharges, and the base payment rates for those discharges. The number of FTE residents who count toward this ratio is capped, and cannot exceed the prior year’s ratio, preventing hospitals from artificially inflating their payments year over year.
Direct Graduate Medical Education (DGME)
DGME payments are calculated by multiplying a hospital’s per-resident amount (PRA) by the weighted number of FTE residents and the hospital’s Medicare share of total inpatient days.14 The PRA varies by specialty, with primary care and obstetrics/gynecology residents weighted at 1.0 and all other residents weighted at 0.5 for years beyond their initial residency period. The PRA is hospital specific and based on each hospital’s reported cost data from the mid-1980s and updated annually for inflation. There is a cap on the number of FTE residents that count toward DGME payments, set for most hospitals at their 1996 resident levels.
Together, IME and DGME form the two pillars of Medicare’s GME funding system — one tied to inpatient discharge volume, the other to historical cost reporting — both governed by formulas that have changed little since the system’s inception, relying on reporting from the 1980s and caps set in the 1990s. In fact, since the funding cap was set at 1996 resident levels, Congress has authorized new funding above the cap only once, in 2021, funding only 1,000 new slots nationwide, which are still being distributed in increments of 200 each year through FY2027.
Following the money: GME funding and physician supply
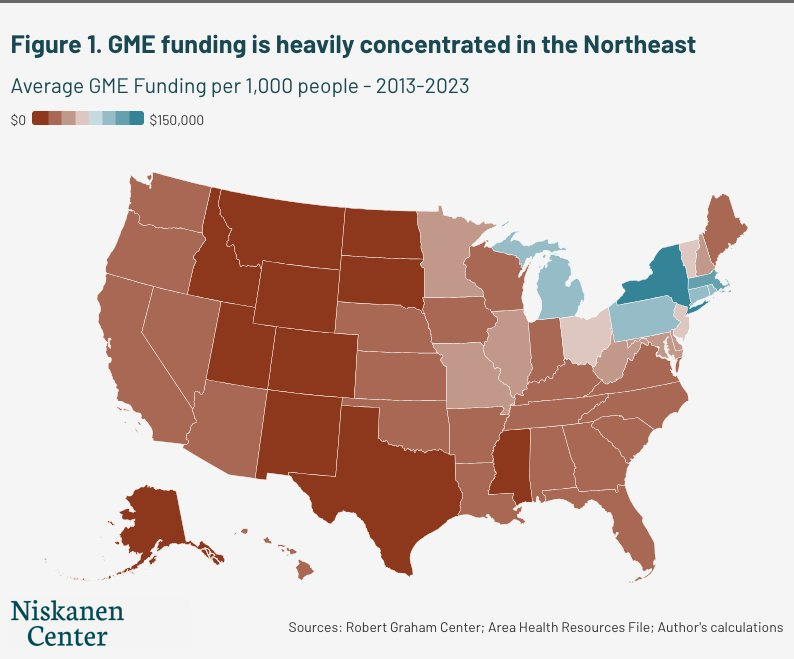
State-by-state and regional breakdowns of GME funding help to clarify how unevenly federal investment in physician training is distributed across the country, favoring certain states where large, academic hospitals are concentrated. Between 2013 and 2023, average GME funding per 1,000 people reveals dramatic differences between states in the Northeast compared with the rest of the country (see Figure 2).
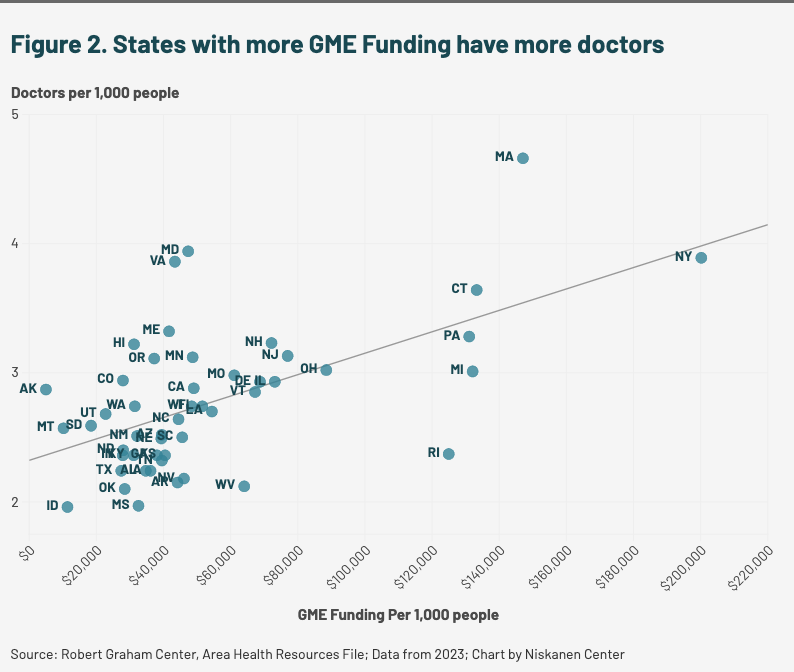
In this 10-year period, Montana, Wyoming, and Idaho averaged under $7,000 in GME funding per 1,000 people, while New York, Massachusetts, and Connecticut averaged over $120,000 — more than 17 times as much. The result is a concentration of federal training dollars in states that already have the highest physician supply (see Figure 2). States with more GME funding tend to have more doctors, and states with less funding tend to have fewer.
This relationship is partly driven by selection. Physicians who prefer working and living in an urban setting likely seek out urban programs. But training location has an independent effect on healthcare supply and access beyond selection. Over half of physicians practice in the state in which they completed their residency,15 and exposure to rural and underserved communities during training is consistently associated with subsequent rural practice even after controlling for background characteristics.16 The formula cannot determine where every physician ultimately practices, but it does determine where federal investment is concentrated.
The most recent data available indicate that only 4 percent of all U.S. medical residents spent more than half of their training in a rural area.17 Nevada and Idaho, whose populations grew by 19 percent and 23 percent respectively between 2010 and 2023 — among the fastest rates in the country — train just 20 residents and four residents per 100,000 people, among the lowest in the nation.
The concentration of funding in the Northeast and the correlation between doctor supply and GME funding is not necessarily evidence that the GME formula caused this maldistribution. Large academic medical centers predate Medicare, and physicians concentrate in the Northeast because that’s where large academic medical centers are and where population density supports specialist practice. While the formula may have reflected a reasonable approximation of national healthcare needs when it was designed, since being frozen in 1997, it has been unable to keep up with changing population trends. By anchoring payments to 1980s cost reports and 1996 resident counts, the GME formula has actively reinforced those historical concentrations for nearly four decades, making it progressively harder for newer, smaller, and more rural programs to build capacity and compete and to better support underserved communities.
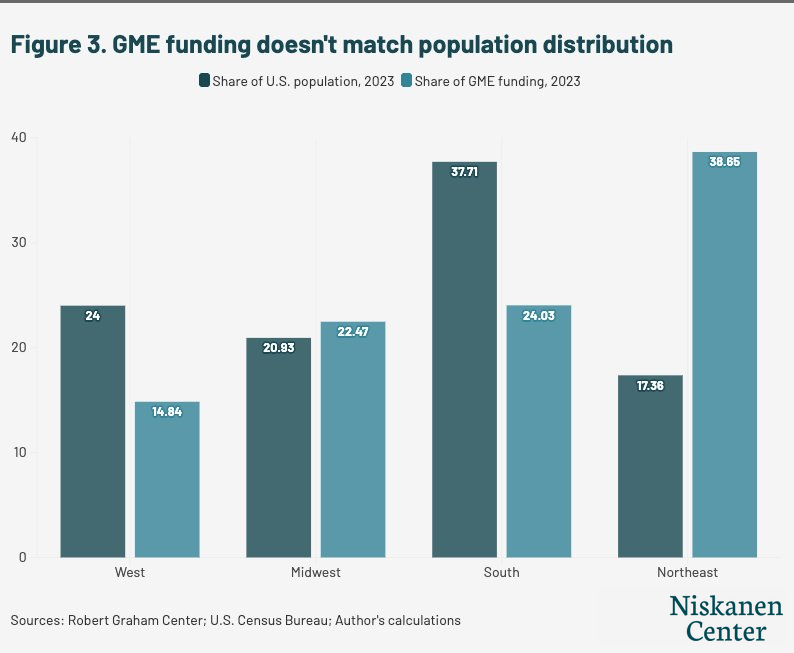
These state-level gaps add up to a regional imbalance. Grouping the country into its four Census regions and comparing each region’s share of GME funding with its share of the U.S. population shows that the dollars do not track where people live. The Northeast region receives a 39 percent share of funding despite comprising only 17 percent of the population. The South, the most populous region with 38 percent of the population and growing, receives a 24 percent share (see Figure 3). In other words, a fixed pool of federal dollars flows mostly to high-cost, low-growth areas that already have plenty of doctors. Those same dollars would buy more new training capacity in faster-growing and underserved places, where physicians are scarce and each dollar stretches further.
Countering the supply crisis will require targeting the areas that need doctor-training dollars the most. But right now, payments follow a rigid formula that unevenly distributes subsidies across states and disproportionately rewards hospitals based on measures that have little to do with meeting patient demand, resulting in a disconnect between needs and funding.
These maldistributions and imbalances are a feature, not a bug, of the GME payment formula. Ensuring a more common sense distribution will require modernizing how we fund residency programs and aligning funding more closely to workforce and patient needs. With an updated, better-aligned payments formula, GME funding can address the gaps in rural and primary care far more effectively, and deliver improvements in access for patients and their communities.
How the GME formula fails patients
Overhauling the Medicare GME payment formula is critical to addressing Americans’ healthcare needs. Having a regular source of primary care is associated with 20 percent lower hospitalization rates and a 50 percent drop in emergency department visits for those with chronic disease such as obesity, diabetes, and heart disease, all of which continue to climb.18 Yet the current formula does little to steer resources toward the communities and specialties where that need is most acute.
The current formula contains three structural features that systematically work against patients in rural and underserved communities, each of which we examine below:
- the formula’s bias toward large urban hospitals at the expense of smaller and rural ones
- its financial incentives that favor specialty training over primary care
- the 1997 cap that locked in these imbalances and has made them harder to reverse
The formula rewards large, urban hospitals at the expense of small and rural hospitals
While this gap in funding reflects the number of residency programs in these states, the core formula has made starting and sustaining smaller, rural programs financially prohibitive. Both IME and DGME disadvantage smaller and more rural teaching hospitals.19
Because IME payments are structured as a percentage add-on to each hospital discharge of a patient, they rise automatically as volume and per-case payments rise. So as the American healthcare system has grown more expensive, more procedure-heavy, and more concentrated in large medical centers, GME funding has mechanically followed. A hospital that performs more expensive procedures receives larger IME payments, which in turn subsidize the training of more residents, which generates more procedures. This is not inherently a problem — complex procedures require specialized training, and large academic medical centers provide care that smaller hospitals cannot. The problem is that the formula treats procedure volume and cost as proxies for training costs, despite the fact that Medicare Payment Advisory Commission (MedPAC), the an independent congressional agency that advises Congress on issues affecting Medicare, has estimated that the current multiplier generates payments up to twice what is empirically justified.20 The formula helps finance this trend, and in doing so it makes it harder to reverse.
Beyond procedure costs, the specific metric the formula uses to calculate IME payments creates a second, compounding disadvantage for rural hospitals. IME adjustments are determined in part by a hospital’s ratio of residents to inpatient beds — the more residents a hospital trains relative to the number of beds it operates, the higher the percentage add-on it receives on each discharge. This means that a hospital with 200 residents and 300 beds (a 0.667 ratio) receives a larger IME adjustment than one with 200 residents and 600 beds (0.333 ratio), regardless of what either hospital’s community actually needs. This measure structurally penalizes rural hospitals, which tend to operate more beds relative to the size of their training programs.
Specialty hospitals concentrated in urban centers, on the other hand, often combine high resident counts with relatively few beds, producing high ratios and therefore large IME adjustments, on top of already-high base payments from expensive procedures. The result is that certain urban specialty hospitals benefit from the formula on both counts simultaneously, while rural general hospitals lose on both. This is why the top 5 percent of teaching hospitals receive an IME adjustment exceeding 33 percent, while the bottom 5 percent receive less than 0.3 percent.21 This kind of concentration reflects a system that rewards how many residents a hospital trains relative to its size rather than one based on any measure of workforce need.
New slots, distributed in the few years following the COVID-19 pandemic, underline this trend. The 2021 Consolidated Appropriations Act created 1,000 new Medicare-funded positions, the first real increase since 1997, and Congress wrote in priority for rural hospitals, hospitals in shortage areas, and states with new medical schools. Yet of the 600 positions distributed between 2023 and 2025, most still went to large urban hospitals that were already among the biggest recipients of Medicare GME payments.22 Fewer than 5 percent reached geographically rural hospitals, and most hospitals that qualified as rural did so only for payment purposes, not by location. A program built to correct the imbalance ended up sending new dollars back through the institutions the formula already favors.
This reflects a longstanding loophole in how Medicare defines “rural.” Under a provision dating to the Balanced Budget Refinement Act of 1999, a hospital physically located in an urban area can apply to be reclassified as rural for payment purposes even though its residents may not train in a geographically rural community.23 A reclassified hospital can be considered rural for IME but remain urban for DGME, which is governed by a separate part of the statute.24 The number of hospitals using this reclassification has grown sharply, in part because it raises Medicare reimbursement more broadly, and the rules do not require these hospitals to direct their expanded training toward the rural workforce shortages the designation is meant to address. The number of geographically urban hospitals carrying rural status climbed from three in 2017 to 425 in 2023, more than three-quarters of them nonprofits, including many large urban academic medical centers.25 The result is that the rural benefit Congress built into IME can flow to urban institutions that carry a rural label on paper alone.
The DGME component of the formula compounds geographic imbalances in a different but equally consequential way. When Congress set the per-resident payment formula in 1985, it locked in each hospital’s baseline at its self-reported 1984 costs, by which point GME was already concentrated in large urban academic medical centers and institutions had a direct incentive to report higher costs to maximize their Medicare payments. Rural hospitals, many of which had little or no training infrastructure, locked in lower baselines that have only been adjusted for inflation ever since. Four decades later, those disparities in federal support persist. The formula has no mechanism to recalibrate based on where physicians are actually needed.26
These same structural features that have concentrated funding in large urban centers have also, over time, shaped the specialty mix of the physicians we train.
The formula rewards specialty slots at the expense of primary care slots
One of the primary reasons smaller and more rural facilities operate more beds relative to the size of their teaching program is because of their role as primary care providers in low-density areas rather than high-volume teaching institutions.
The resident-to-bed ratio compounds this problem for primary care. The ratio counts all residents in its numerator, so primary care residents do raise it, but the resulting add-on is applied only to a hospital’s inpatient payments. A hospital that expands its primary care training, which takes place largely in outpatient clinics and community settings, generates little inpatient volume and thus sees little additional IME revenue. By contrast, a hospital that expands specialty training in inpatient-heavy fields such as cardiology or oncology improves its ratio and collects larger IME add-ons with every discharge those residents are involved in. For hospital administrators making decisions about which residency programs to grow, this creates a clear and persistent financial signal to pursue nonprimary care specialties. Economists studying physician market competition have since documented the consequences: persistent excess demand for high-income specialty slots, unmatched rates exceeding 20 percent in fields like dermatology and orthopedic surgery, and a widening earnings gap between specialists and primary care physicians that reached $265,000 to $680,000 by 2024.27
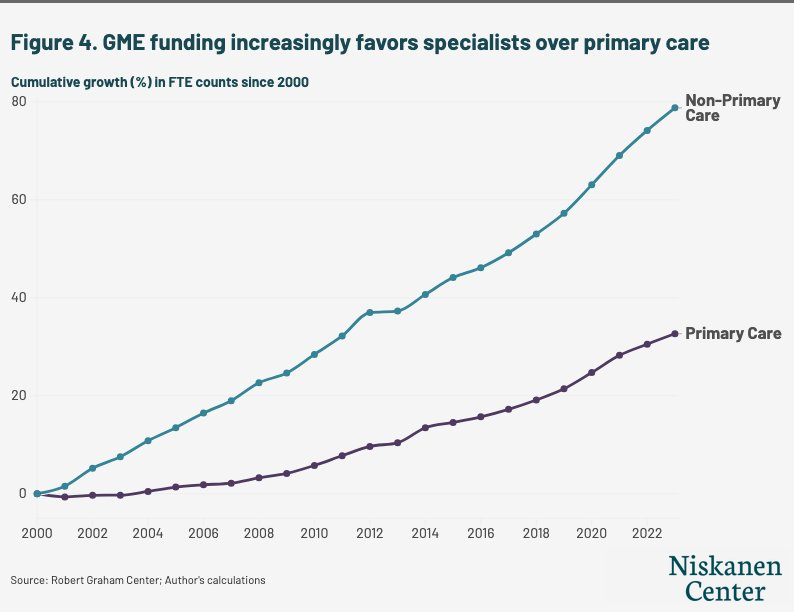
The data reveals this preference clearly: Since 2000, GME funding has expanded specialist training positions 2.4 times faster than primary care positions (see Figure 4). This shift has been decades in the making: primary care accounted for 55 percent of residency slots in 1981 and has fallen steadily since.28 This problem is exacerbated by a dynamic concealed in this figure: 37 percent of internal medicine residents, categorized here under “primary care,” do not go on to practice primary care at all. During the later parts of their residency programs, they often subspecialize in cardiology, gastroenterology, or oncology instead.29 This is a recent development. Prior to 2000, 54 percent of third-year internal medicine residents planned to practice primary care.30 Today, nearly 90 percent go on to subspecialize or practice hospital-only medicine, leaving around 10 percent actually practicing primary care.31
And once again, the flow of funding is disconnected from the demands reflected in broader national trends. Outpatient visits grew by 31 percent between 2000 and 2023, reflecting a significant shift in how and where Americans receive care.32 Yet, GME funding continues to reward hospitals exclusively for inpatient activity by basing the largest portion of funding on inpatient discharge volume, leaving the fastest-growing segment of American healthcare without a corresponding training incentive.
The 1997 cap on funding discourages new programs and new expansions
In the 1997 Balanced Budget Act, Congress imposed caps on both the DGME and IME components of Medicare GME funding, freezing each hospital’s Medicare-supported resident count at its 1996 levels for each payment type. Because GME funding is allocated on a hospital-specific basis, this effectively locked in the geographic distribution of residency training at a time when it was already heavily concentrated in large urban academic centers.
A common misconception about the 1997 cap is that it froze the total number of residents being trained in the United States. But hospitals can and do fund residency slots above their Medicare-reimbursed caps using other revenue sources such as private financing, state-level funding, and other federal sources. In fact, the total number of residents in training has grown substantially, from roughly 98,000 in 1997 to over 167,000 in 2024–2025, a 70 percent increase.33 The cap’s ill effect is more specific to where slots are located and which kinds of programs can create them. It froze the distribution of Medicare funding at its 1997 levels, meaning that growth above the cap has flowed disproportionately to large urban programs with the financial resources to fund slots without federal support, while smaller and rural programs, operating on thinner margins, have largely been unable to do the same. The result is a resident workforce that is increasingly concentrated in institutions and specialties that were already well-resourced.
There are economies of scale to training residents, meaning large hospitals can operate above their caps and generate net revenue from their programs, while smaller and rural programs face significant challenges opening residency programs in the first place. A formula that relies on IME as the primary mechanism for funding residencies structurally disadvantages smaller programs. Hospitals starting their first GME training program spend an estimated $2 million to $8 million over three to seven years to establish programs, and Medicare does not begin making payments until residents are already in training.34 This is a front-loaded cost burden that large, established programs are either prepared to absorb or already have absorbed.
The evidence is clear: Over 80 percent of large programs fund slots above their caps while only 23 percent of small programs are able to do so (see Figure 5).
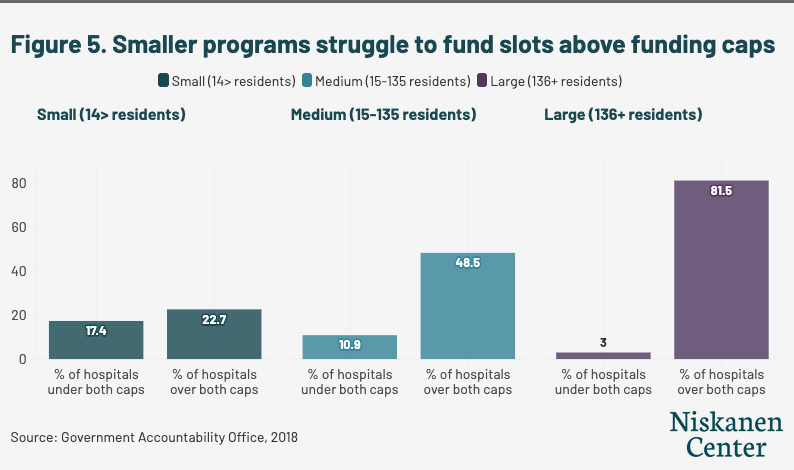
Similar dynamics can be observed in rural versus urban programs. Only 37 percent of rural residency programs are able to fund more slots than Medicare reimburses for, compared with over 50 percent of urban programs.35
The barriers to entry extend even to hospitals that have never operated a residency program. At a House Ways & Means Committee hearing on GME funding in February 2026, Dr. Thomas J. Mohr, dean of the College of Osteopathic Medicine at Sam Houston State University in rural Texas, acknowledged this struggle, telling Congress, “I have several community-based hospitals that are interested in starting their first GME program, but because a few residents rotated at those hospitals in the early 2000s for ‘elective’ rotations from other established residency programs, the hospitals are now capped for future funding.”36 Because Medicare counts rotating residents from another program that a hospital hosts toward that hospital’s cap, some hospitals are essentially preemptively capped despite never operating a residency program.37
Congress has recognized this problem, and in the Consolidated Appropriations Act of 2021, created a five-year window for affected hospitals to reset resident caps. But the fix has reached few of the hospitals it was meant to help. Of 219 hospitals identified as eligible, only about one in 10 qualified for a cap reset as of 2023, because the reset itself requires training a threshold number of residents, a difficult task for hospitals that have not had robust programs.38
It is clear that the 1997 cap cemented the regional distribution of funding and limited smaller programs by limiting the financial capital needed to expand or create programs and bring in new residents. But lifting the cap without fixing the underlying payment mechanics would simply direct new slots to the same large urban programs that have benefited from the formula for decades, leaving the geographic and specialty imbalances intact. Policymakers should address both the structural flaws of the formula and the unintended consequences of the 1997 cap to ensure that better incentives are baked into this critical subsidy.
Options to fix it: Funding the right doctors in the right locations
The case for reforming Medicare’s GME formula has been building for years, and Congress recently has been making progress toward solutions.
In late 2024, a bipartisan Senate GME Working Group led by Senators Bill Cassidy (R–La.), Catherine Cortez Masto (D–NM), John Cornyn (R–Texas), and Michael Bennet (D –Colo.) proposed legislation that would fund an additional 5,000 residency slots and reform some aspects of the program.39 The proposal takes meaningful steps on three fronts: 1) It introduces a nationally uniform per-resident number of new slots, addressing the decades-old disparities baked into historical cost reporting; 2) provides relief to programs disadvantaged by historically low resident caps; and 3) requires the Centers for Medicare and Medicaid Services (CMS) to publicly report GME payment amounts, resident demographics, specialty mix, and the share of Medicare-supported residents who go on to practice in underserved and rural areas, giving Congress the tools to evaluate whether GME dollars are producing the physician workforce Americans need. The draft legislation represents an important first step to increase doctor supply and modernize the program, but these reforms apply only to DGME, which represents 29 percent of Medicare GME funding. By leaving IME untouched, the structural incentives driving geographic concentration and specialty imbalance remain intact.40
More recently, in the February Ways & Means Committee hearing examining the effectiveness of GME payments in producing the next generation of the healthcare workforce,41 lawmakers and residency program managers highlighted structural flaws in how Medicare distributes GME payments. They pointed to struggles that smaller and rural programs experience in competing for Medicare-funded slots, accessing the capital needed to establish new programs, and navigating a formula that systematically directs dollars toward larger, more established institutions.42
Our suggestions below are primarily a matter for Congress, as the structural issues in Medicare’s GME formula are embedded in statute and that durable solutions require statutory change.43
The following recommendations offer discrete policy options, each addressable independently, that would reorient GME funding toward the needs of patients. They follow directly from the structural flaws described above. Modernizing IME and redirecting dollars toward underserved areas would correct the formula’s bias toward large urban hospitals, expanding primary care training would address the tilt away from the doctors patients most need, and removing barriers to new program creation would help undo the constraints the 1997 cap locked in. Importantly, the recommendations that we model are budget-neutral and require no new funding.44
Modernize IME for the Outpatient Era
There are two potential ways to ensure that IME payments better reflect where care is actually delivered. One of the most straightforward and effective ways to do this is to extend IME payments to outpatient settings. Congress could also update the formula’s measure of teaching intensity to count both inpatient and outpatient patient encounters, rather than inpatient beds alone.
Rebalance IME payments across inpatient and outpatient settings (IPPS/OPPS adjustment): As the share of care delivered in outpatient settings has grown, tying IME payments exclusively to inpatient services has become increasingly difficult to justify. Per MedPAC’s recommendation, Congress should direct CMS to extend IME payments to outpatient settings by applying the IME adjustment to OPPS services, while reducing the inpatient IPPS multiplier proportionally to reflect the shift in where care is actually delivered.45
Our modeling shows that under a rebalancing scenario, 70 percent of rural hospitals would see gains in IME funding corresponding with around 65 percent of urban hospitals seeing losses in funding (see Figure 6). This result would follow directly from the structural logic of the reform: Rural hospitals deliver a larger share of their care in outpatient settings relative to their inpatient volume, meaning they are penalized most by the inpatient-only structure and stand to benefit most from an extension of IME payments across care settings. This reform can be implemented in a budget-neutral way by adjusting the IPPS and OPPS multipliers simultaneously, or paired with additional investment to expand the overall pool of GME funding.46 This also would remove the disincentive to train residents in outpatient rather than inpatient settings, reducing the mismatch between healthcare demand and supply and discouraging excess inpatient care.
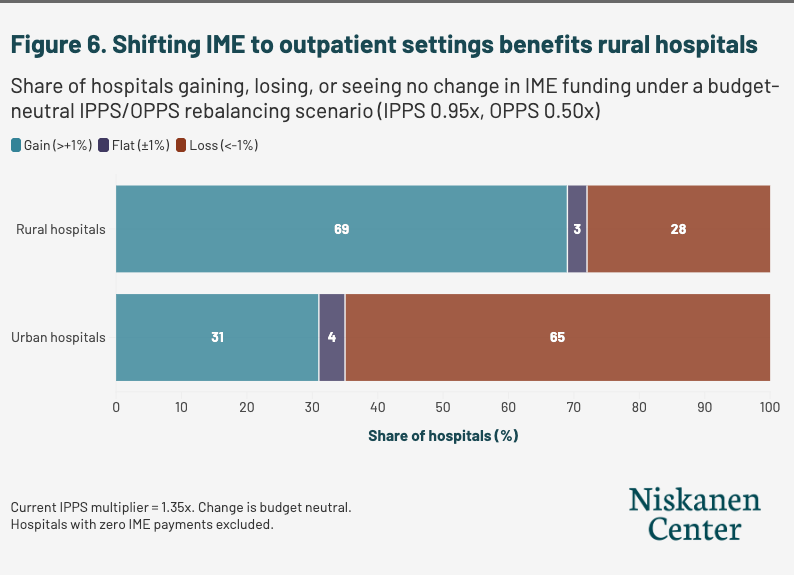
Decouple IME payments from the resident-to-bed ratio: In addition to tweaking the multipliers, Congress could direct CMS to replace the resident-to-bed ratio as the measure of teaching intensity with a ratio that would count both inpatient and outpatient activity, as recommended by MedPAC.47 The current ratio, using inpatient beds as its denominator, systematically undercounts the teaching activity of hospitals that have shifted care to outpatient settings. Transitioning to a ratio that better takes into account outpatient services and actual patient encounters rather than beds would offer hospitals an incentive to expand outpatient primary care training, aligning the formula more closely with broader trends in utilization.
Direct more slots to rural and underserved areas
We offer two potential budget-neutral policy paths to better support underserved areas with the GME subsidy — one focused on increasing the number of slots for small and rural programs, and another focused on increasing the payments to regions beset by shortages. While both reforms would bolster underserved programs and regions, the first would target the structural advantage that large programs hold over smaller ones, while the second would tie payment levels directly to regional physician shortages, ensuring dollars flow to where the workforce need is greatest.
Congress should also close the dual-classification loophole, which allows hospitals designated as urban for most purposes to capture rural GME subsidies regardless of whether their residents ever serve rural populations.
1. Increase slots for smaller residency programs and introduce a rural training bonus paired with a declining marginal payment for high-volume slot holders
These steps would redirect GME dollars toward programs best positioned to address rural shortages, such as those that cannot fund more slots above their cap due to lack of funding, while reducing the compounding advantage that large, slot-heavy institutions currently enjoy. This policy would not be intended to penalize scale, but instead to stop treating size as a proxy for merit. Large programs benefit from economies of scale, but those economies are partly a product of the formula itself. Decades of concentrated GME funding have allowed large institutions to absorb fixed costs, an opportunity that smaller programs have never had. Targeting funding to capacity-constrained smaller programs could increase physician supply in a more targeted fashion while maintaining supply among larger programs that benefit from residency programs even with lower levels of subsidy because of their economies of scale.
Figure 7 shows the impact of applying a declining marginal payment rate to residency slots above 200 FTEs. The savings are redistributed to all programs proportional to their size, with rural programs receiving a 10 percent larger share of savings per FTE. Under this model, programs with 101–200 slots would see around a $260 million increase in GME funding, and every program below 400 FTEs would gain funding overall.48 Programs above 400 FTEs see reductions ranging from around $110 million in aggregate to over $610 million for the largest programs — institutions that already capture a disproportionate share of GME dollars and carry the most existing capacity.
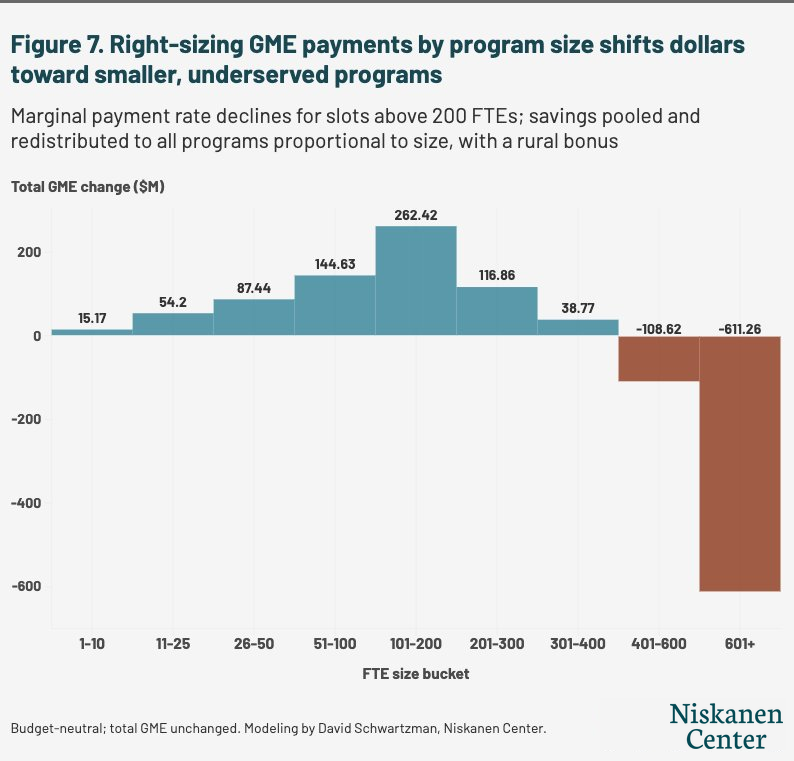
2. Increase residency payments in states with shortages of physicians by decreasing payments in states with higher-than-average physician supply
A formula tied to state or regional physician-to-population ratios compared with the national median would redirect GME dollars toward the areas most in need of additional training capacity, rather than reinforcing concentrations that have persisted since 1997.
Under this model (see Figure 8), the formula reveals a sharp regional imbalance in how GME dollars are currently distributed. States across the Mountain West, South, and Great Plains, which tend to have higher physician shortage burdens relative to their existing training infrastructure, would see the largest percentage increases under a shortage-based redistribution. Meanwhile, funding reductions would be concentrated in the Northeast and Mid-Atlantic, where GME investment has historically been densest and physician supply is higher.
Our model does this by measuring each state’s shortfall against national benchmarks for both residency training and physician supply, then funding new slots to close 25 percent of that gap at the national average cost per resident. The cost would be recovered from states that exceed both benchmarks. In gaining states, new funding would be distributed to hospitals in proportion to their existing GME, with rural hospitals receiving double weight.
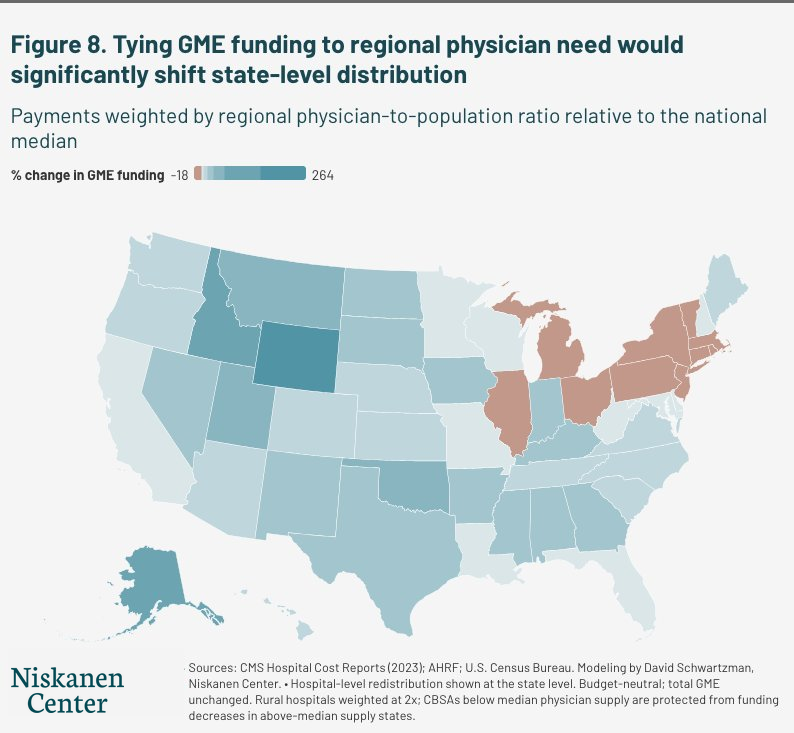
Redirecting GME dollars away from high-funding states would require confronting an important tradeoff: States such as New York, Illinois, and Ohio include large underserved urban populations that depend on academic medical centers for care. Our proposed reform would protect hospitals in Core Based Statistical Areas below the median physician-to-population ratio regardless of state, meaning underserved urban hospitals in high-funding states would be shielded from reductions. The only hospitals that would lose funding under this model would be those in above-median supply areas that have benefited most from the formula’s compounding advantages. This proposal also would close only 25 percent of the differential between supply and population, meaning that regional variations in GME funding would persist.
3. Close the dual-classification loophole that allocates most rural GME funding to large urban hospitals
Hospitals classified as urban for most purposes but rural for GME purposes currently capture the majority of rural-related GME subsidies, regardless of whether their residents ever serve rural populations. Redirecting these dollars toward areas with genuine physician shortages would ensure that rural-designated funding reaches the communities it is meant to serve.
Train more primary care doctors
We offer two complementary policies to ensure GME funding would train more primary care doctors than the status quo. One focuses on weighting the formula for DGME and IME toward primary care, and we model how this could be done under the current DGME formula. Widening the per-resident amount differential for primary care would create a stronger financial incentive for teaching hospitals to expand primary care training capacity. But under the current formula, rural and smaller hospitals start from lower baselines due to four decades of historical cost reporting. Reforming those baselines in our second recommendation would ensure that the hospitals most likely to train the primary care physicians whom Americans need can actually benefit from the improved incentive.
However, expanding primary care slots is only one part of an equation that relies on a workforce of medical students who want to practice primary care, despite the relatively higher pay and prestige that other specialties can offer. Physician specialty choices are shaped by more than residency funding alone, but it is clear that with additional residency programs, there would be a higher supply of primary care doctors. There are plenty of programs that are set up to expand their primary care programs if given additional support.
1. Increase per-resident amount (PRA) differentiation for primary care
The PRA weighting for primary care currently applies only to DGME, which represents 29 percent of Medicare GME funding. Widening the payment differential for primary care residency slots under DGME would give teaching hospitals a stronger financial incentive to expand primary care training capacity. IME, which represents the remaining 71 percent of GME funding, currently has no primary care adjustment at all. Extending need-based payment differentiation to IME would create a meaningful financial signal where it is currently absent, and represents the logical next step for Congress once DGME differentiation is established.
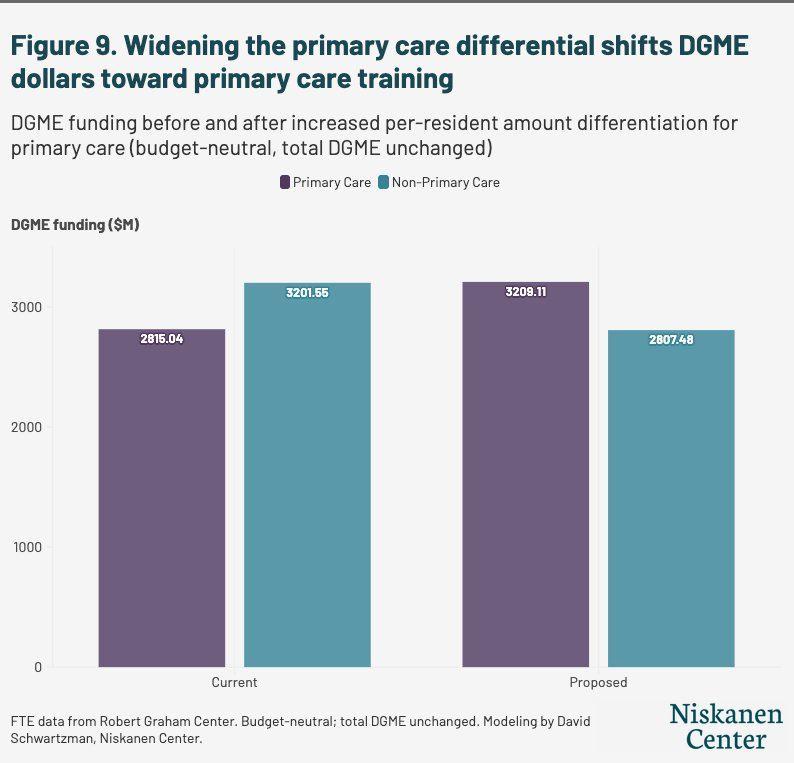
Under this reform, we only model how a wider differentiation for DGME would shift funding toward primary care slots relative to nonprimary care ones. Currently, nonprimary care DGME outpaces primary care DGME by almost $400 million (see Figure 9). Under this scenario, DGME funding for primary care would outpace nonprimary care funding by over $400 million, providing programs a better incentive to attract primary care residents and expand primary care residency opportunities.
2. Reform DGME’s historical baselines
Medicare’s direct payments remain anchored to cost reporting from the mid-1980s, locking rural hospitals into lower per-resident amounts that have simply been adjusted for inflation ever since. Congress should update the PRA baseline to reflect current costs and establish a geographically uniform PRA that adjusts based on local wages, urban or rural status, or workforce needs rather than four-decade-old cost reports. The Senate Finance Working Group’s recent proposal included a new uniform PRA for newly created slots, affecting only DGME rather than IME.49 While a meaningful step, this approach addresses only 29 percent of Medicare GME funding. A more comprehensive reform would extend uniform payment logic to IME as well, consolidating DGME and IME into a single geographically adjusted per-resident payment.
Any reform targeting primary care training should also account for the reality that internal medicine residents, who are counted as primary care for GME purposes, mostly do not go on to practice primary care. Any programs targeting primary care must consider treating family medicine and general pediatrics preferentially to internal medicine, helping to ensure that a primary care residency slot produces a primary care physician.
Remove barriers to new program creation
In addition to addressing the GME formula’s flaws that disadvantage primary care and underserved areas, there are still foundational problems that prevent new residency programs — that is, the capacity that we need to address the physician shortage. Front-loading funding for new programs and tweaking ill-designed policies from the 1990s are both needed to allow for the creation of more residency programs.
1. Front-load funding for new residency programs
Hospitals starting their first GME training program spend an estimated $2 million to $8 million over three to seven years before Medicare begins making payments, a front-loaded cost burden that large, established programs absorbed decades ago. Congress should front-load GME payments for new programs, concentrating funding in the early years when capital costs are highest, and consider extending the cap-establishment window beyond five years for under-resourced hospitals, giving them more time to build the faculty and infrastructure needed before their funding is permanently frozen.
2. Fix the preemptive cap problem
Hospitals that hosted a handful of rotating residents from other programs decades ago find themselves permanently capped for Medicare funding despite never having operated a program of their own. When residents from a new program rotate through a hospital, CMS treats that hospital as a “new teaching hospital,” which triggers both its per-resident amount and its DGME and IME resident caps. This prevents hospitals otherwise positioned to expand training capacity from doing so, and the GME formula should be a tool to encourage new program creation rather than stifle it. Congress’s 2021 attempt to let these hospitals reset their caps reached only a small share of eligible institutions.50 A durable fix would allow affected hospitals to reset without first having to finance the training that the cap makes financially burdensome.
Conclusion
America’s healthcare-access struggles are not inevitable. The same formula that for decades has financed the wrong trends can, with targeted reforms, be used to fix them. Congress has a $21 billion lever and an opportunity to direct the single largest federal investment in physician training closer to where it is actually needed.
But Congress does not need to start from scratch. The bipartisan interest in GME reform is real, the structural problems are well-documented, and the policy options are tractable. Modernizing how IME payments are calculated, redirecting dollars toward states and regions with genuine physician shortages, strengthening incentives for primary care training, and removing the barriers that prevent smaller and rural hospitals from building training capacity are all achievable within the existing framework. None of these changes would require new spending, only a more deliberate use of what is already being spent. The same formula that for decades has reinforced existing concentrations of medical training can become a tool for building the physician workforce Americans actually need.
Methodological Appendix
Figures are designed to illustrate the directional effects and approximate magnitudes of each reform option. Medicare cost reports capture hospital-reported cost and payment variables and reported DGME and IME funding, but do not include the claims-level detail that would be required to model every aspect of GME payment mechanics with full precision. Results should be interpreted as reasonable, internally consistent estimates of reform direction and approximate scale. Budget-neutrality is maintained by construction in each simulation. Readers should treat these figures as a starting point for more granular modeling using claims data.
Source data and common definitions
Figures 1 4 are based on data from the Robert Graham Center and census population estimates from Area Health Resource Files. Figures 6–-9 use 2023 RAND HCRIS Medicare cost report data. 2023 data is also used for the Robert Graham Center, the Area Health Resources File, and census population estimates.
Physician supply (Figure 8) data is drawn from the 2023 Area Health Resource File, summing office-based and hospital-based MDs and DOs. Population data is from census population estimates. Primary-care FTE shares (Figure 9) come from the Robert Graham Center hospital-level residency panel, matched to cost-report hospitals by CMS provider number.
Two conventions apply throughout. First, negative values in payment and FTE fields are treated as reporting artifacts and set to zero. Second, hospitals are classified as rural if their Rural-Urban Continuum Code is 4 or greater, and urban otherwise.
Each simulation conserves budget-neutrality by construction.
- Figure 6 solves for the inpatient reduction equaling the outpatient addition.
- Figure 7 computes the savings pool first, then defines every recipient’s gain as a share of that exact pool, balancing DGME and IME as separate pools.
- Figure 8 recovers the precise cost of new slots from surplus states as shares of that cost.
- Figure 9 solves the non-primary-care scalar as the exact residual that refills the matched DGME total after the primary-care boost.
For Figures 7 and 8, where slot equivalent dollars are used, slot-equivalents are reported at the CY2023 national average DGME cost of $65,179 per capped FTE. Because IME payments vary hospital by hospital and do not scale linearly, they are difficult to estimate precisely. As a result, we do not model them directly, so estimates serve as a lower bound to the dollars that would be reallocated.
Figure 6: IPPS/OPPS operating IME rebalancing
Medicare’s operating IME adjustment scales each hospital’s inpatient payments by a training intensity factor that rises with its teaching intensity, measured by the capped resident-to-bed ratio r. The statutory adjustment factor is:

The outpatient base is Medicare OPPS x 0.88. The 12% estimated reduction is estimated based on the MedPAC’s exclusion of separately payable Part B drugs and devices from the OPPS IME adjustment base. MedPAC’s estimate is based on analysis of Medicare claims data.
Because the outpatient and inpatient pools differ in size, this model needs to define the ratio between them to keep any swaps in funding balanced. This total calculated ratio of IPPS DRG payments to OPPS payments (excluding estimated drug spending) for hospitals receiving residency funding is defined as K. The ratio is used to compute multipliers to OPPS payment and IPPS payments that keep total IME funding constant. For an OPPS multiplier of 0.5, an IPPS multiplier of 0.95 is budget-neutral by construction.
Maryland hospitals are excluded from this calculation because under the Maryland All-Payer Model waiver, IME payments are not operating under IPPS/OPPS payment and are rather operating under a global budget.
Figure 7: Right-sizing payments by program size
Parameters: threshold, cutoff, and floor
- Cutoff: the program size at which the marginal payment rate reaches its floor and stops declining.
- Threshold (fixed at 200 FTEs): the program size below which a hospital’s full FTE count enters the allocation weight.
- Floor (fixed at 0.50): the minimum marginal payment rate. Slots above the cutoff are paid at 50% of the current rate.
Marginal rate schedule
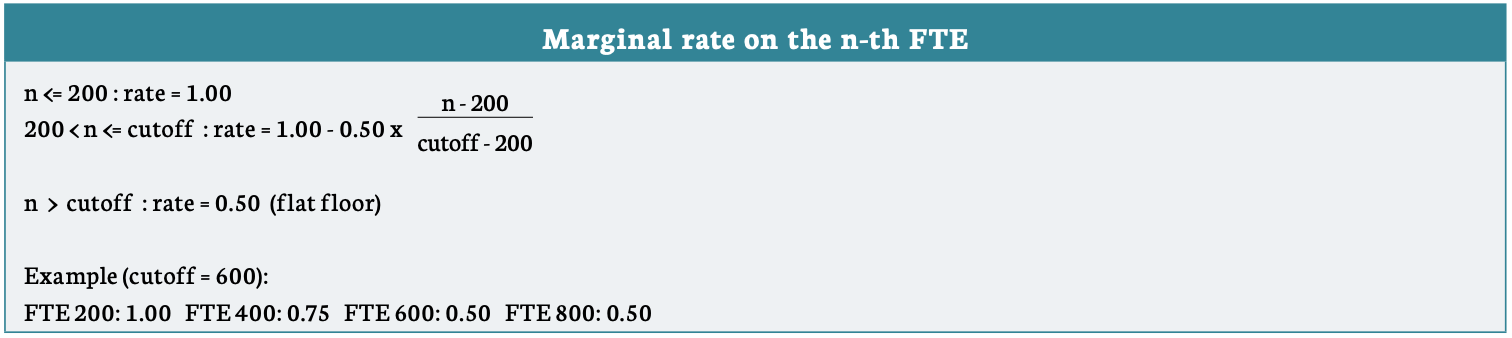
The decreased spending from the lower funding over 200 slots is pooled and distributed across all residency programs in proportion to each program’s first 200 slots, whether or not the program has more than 200 total slots. All programs receive new funding at the same dollar rate per capped FTE, weighted by a rural adjustment: rural programs receive a 10% larger share per FTE than otherwise identical urban programs.
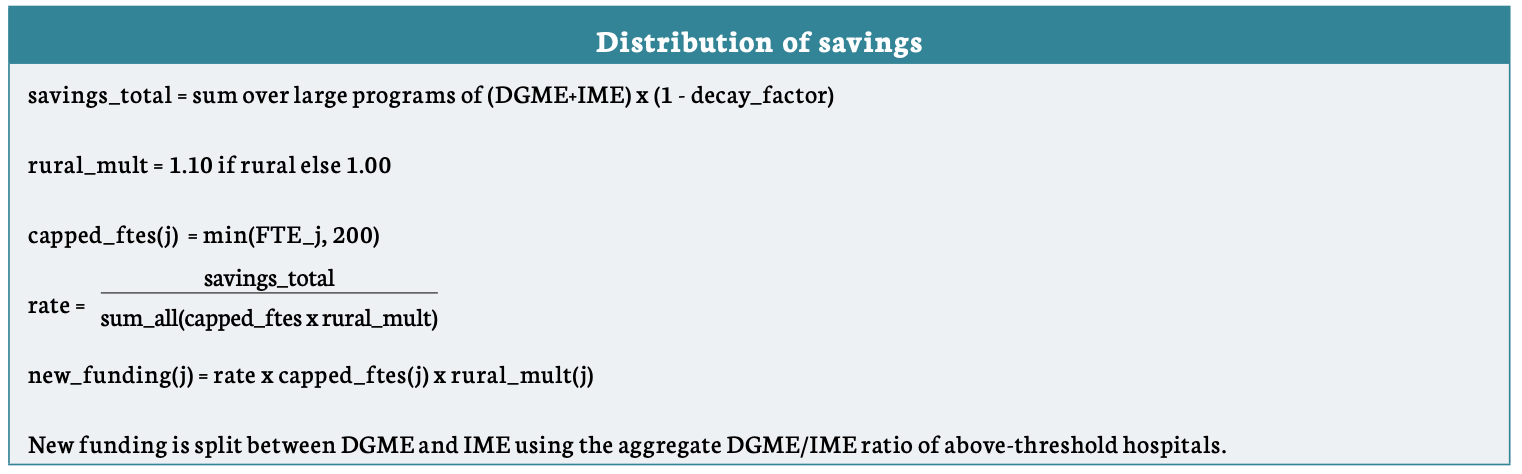
A hospital’s change in FTE funding is calculated as the increased funding for the first 200 FTE slots minus the reduction applied across its slots above 200.
Total funding is still strictly increasing in FTEs at all program sizes. The reduction applies only to the marginal rate on slots above 200. A program with 201 FTEs keeps full payment on its first 200 and receives an additional payment on its 201st.
The marginal rate stays above 0.5 of status quo slot funding, so every additional resident a program takes on raises its total funding. There is no FTE count at which a hospital would receive more funding by shedding a slot, so the schedule creates no incentive to bunch at 200 or anywhere else.
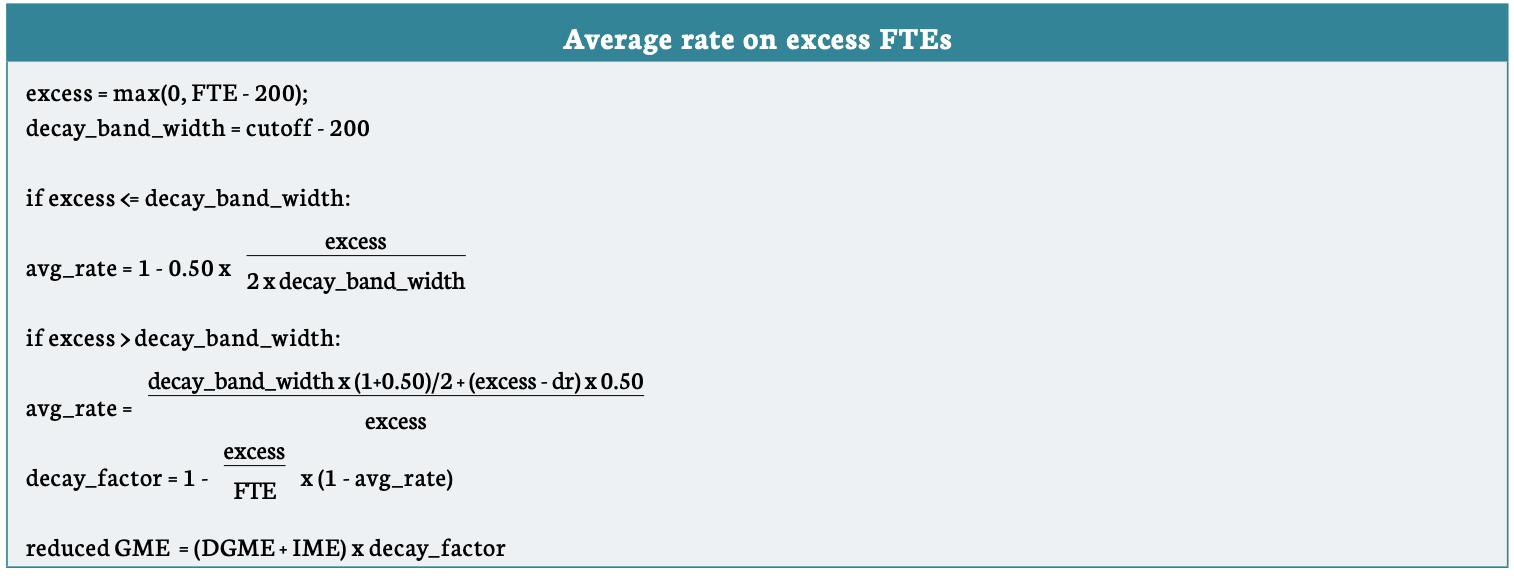
Figure 8: Regional need-based redistribution
National benchmarks
Two national reference rates are computed from the 2023 HCRIS cost report and AHRF data. The residency rate is total resident FTEs per capita, while the physician rate is the total national physicians per 100,000.

State shortage gaps
Each state’s shortage is measured as the positive shortfall against the national benchmark, on three metrics. The residency gap is how many residents the state would need to reach the national per-capita average . The physician gap is the number of additional physicians the state would need to reach the national supply rate per 100,000 people. The blend is the average of the residency and physician gaps, weighted equally in Figure 8. States with a surplus compared with national averages are the payers.
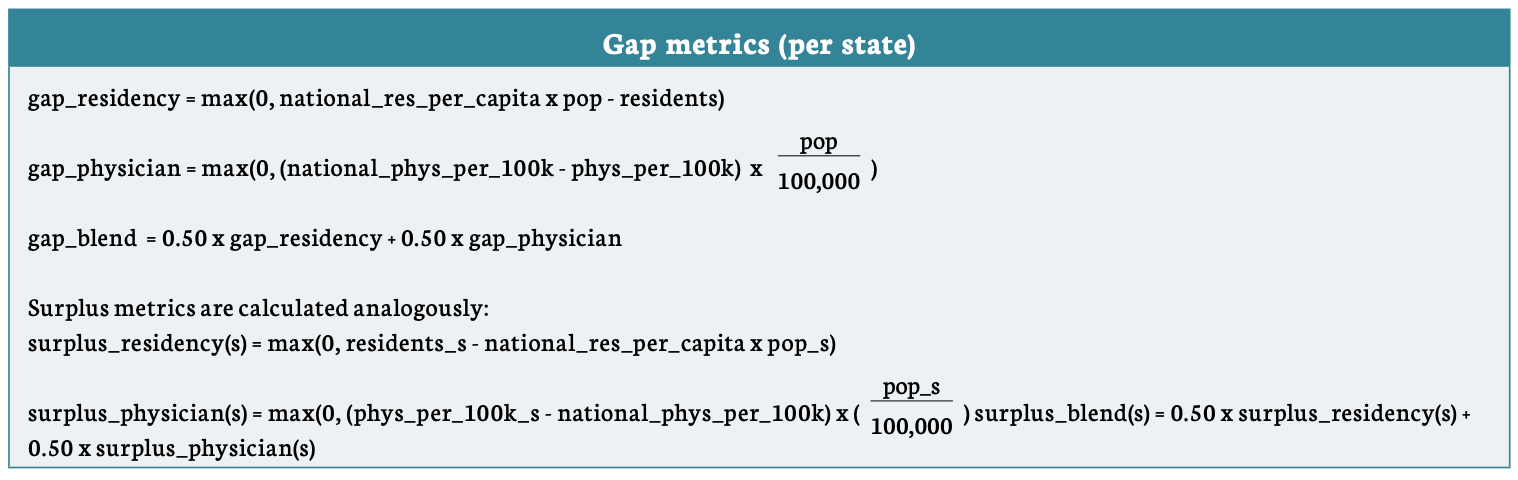
New slots equal a closure fraction (set to 0.25) times the state’s gap, funded at the national average per resident. The total cost of all new slots is then recovered from surplus states in proportion to their current GME surplus relative to population. Within each surplus state, the decrease is applied only to hospitals in CBSAs with residency density at or above the national average, while funding decreases are not applied to areas below the national average. Within each surplus state, the funding reduction on eligible hospitals is scaled by a constant set so that the state contributes exactly its assigned share of the total cost, as removing 25% of the state gap from states with slot shortages represents a different number of residency slots as compared to removing 25% of the state gap from state with slot surpluses.
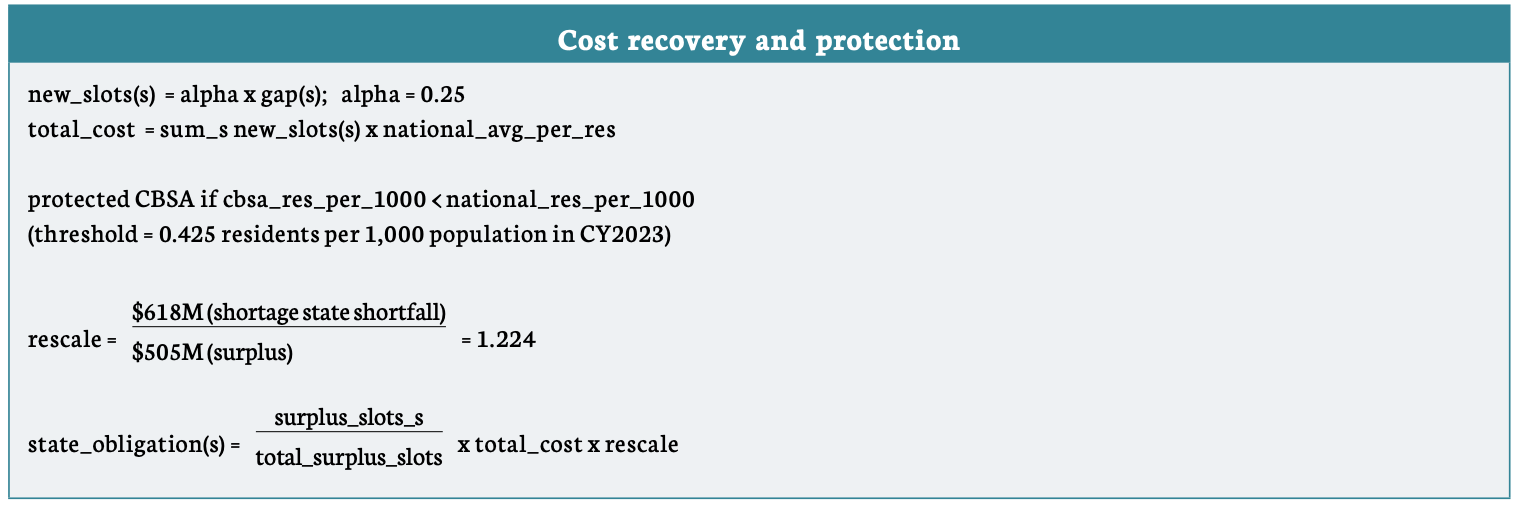
This corresponds to about 9,480 existing slots being redirected from surplus states to shortage states in DGME slot funding terms. That number could be a starting point for legislation to replicate these effects based on these calculations.
Within-state allocation in gaining states
In states that gain, the new funding is distributed across that state’s hospitals in proportion to current GME times a rural weight of 2.0, so rural hospitals in gaining states receive double share per dollar of existing GME. Each hospital’s alternative GME is its current GME plus any new funding minus any haircut. DGME and IME are then rescaled proportionally to preserve each hospital’s original split.
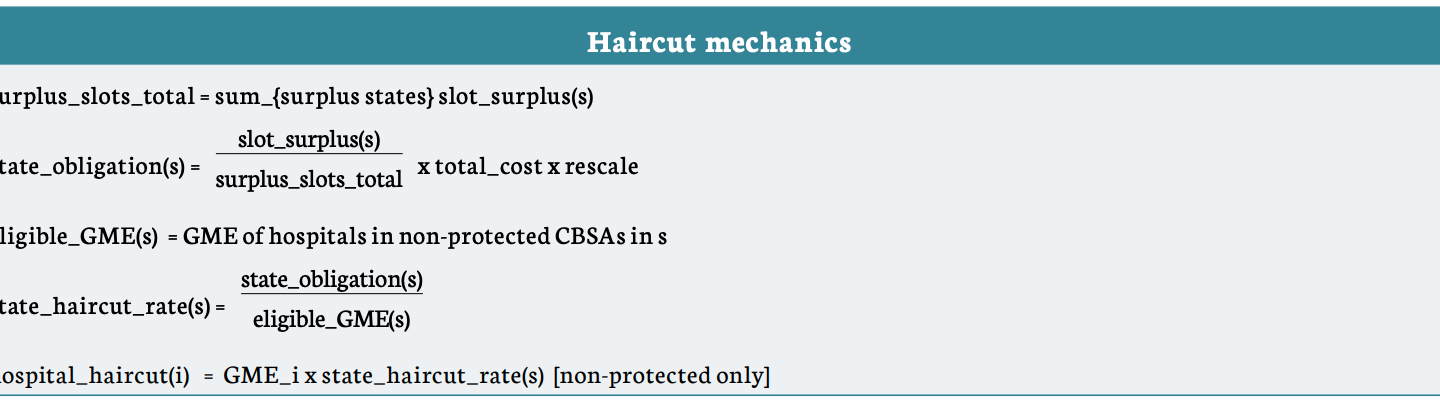
Figure 9: DGME primary-care reweighting
Splitting DGME by specialty mix
This scenario operates only on DGME, while IME is unchanged. Each matched hospital’s DGME is divided into a primary-care and a nonprimary-care component using its primary-care share of resident FTEs from the 2023 Robert Graham Center data. A hospital is included if it appears in the Robert Graham Center hospital panel with positive total FTEs. Unmatched hospitals are held at their current DGME and are excluded from the reweighting.

In 2023, the implied average primary care per-resident amount (PRA) was 8.2% higher than the average nonprimary care PRA.
The reform sets a target ratio R of primary-care to nonprimary-care payment per FTE, and jointly solves for the boost factor B applied to the primary-care component and the offsetting scalar S applied to the nonprimary-care component, such that B/S = R and total matched DGME is preserved. Solving the two constraints simultaneously:
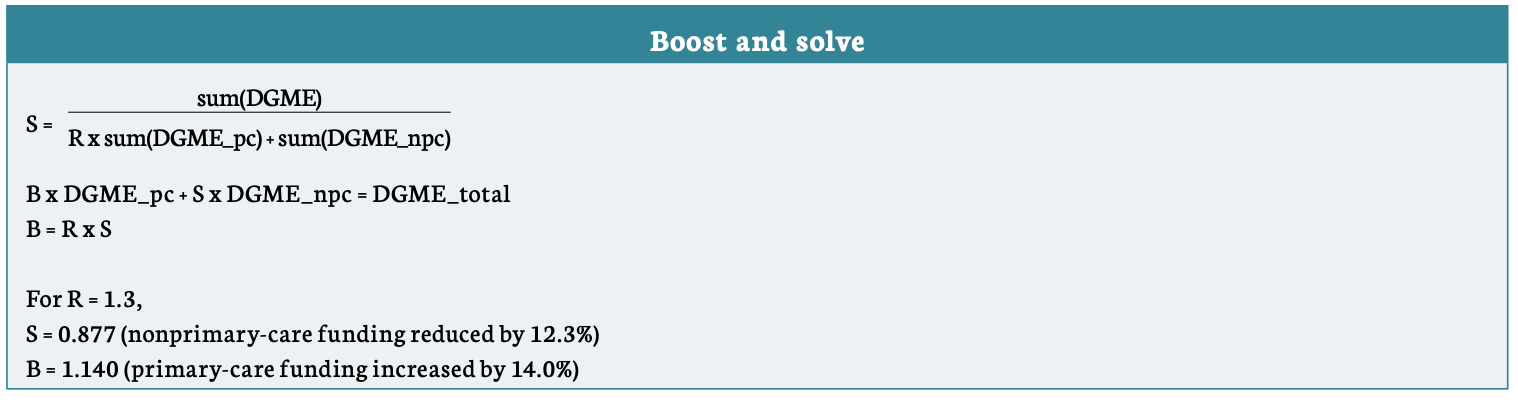
The matched-hospital DGME total is preserved by construction, as S is defined as exactly the residual needed to refill the total after boosting primary care funding. The reform changes the primary-care/nonprimary-care mix without changing the national DGME spending share of total GME funding.
The primary-care share is measured by FTE counts as opposed to FTE counts weighted by each group’s per-resident amount (PRA). However, the two methods produce nearly identical results.
About the authors
Lawson Mansell is a Senior Health Policy Analyst who works on ways to improve the supply of affordable healthcare. Prior to joining Niskanen, he was a research associate at the Milken Institute in Santa Monica, Calif., where he authored reports on regional workforce trends and health disparities. Mansell previously had worked on education and healthcare policy issues in his home state of South Carolina, where he also served on the staff of South Carolina’s 1st congressional district. His analysis has appeared in The Hill, The Argument, The Philadelphia Inquirer, and other publications.
Mansell completed the Health Reformers Academy fellowship in 2023. He earned a master’s degree in public policy from Pepperdine University School of Public Policy and a bachelor’s degree in political science from Thomas Edison State University.
David Schwartzman is a health economist with experience researching and advising on federal payment policy and healthcare delivery reform. He served as an economist at the Center for Medicare and Medicaid Innovation, where he advised on Accountable Care Organization (ACO) model development and led financial policy for ACO REACH, a $37 billion annual payment model serving 2.4 million Medicare beneficiaries. His research has examined the impact of employer-based and government alternative payment models and of regulatory frameworks for healthcare supply.
Schwartzman earned a doctorate in economics from Washington University in St. Louis and a bachelor’s degree from Hillsdale College in economics and applied mathematics.
- “The Complexities of Physician Supply and Demand: Projections From 2021 to 2036,” Association of American Medical Colleges, March 2024. ↩︎
- “The Complexities of Physician Supply and Demand: Projections From 2021 to 2036,” Association of American Medical Colleges, March 2024. ↩︎
- Daniel Siegel, “Recruitment Challenges, Solutions, and Outlooks for the Rural Doctor Shortage,” National Rural Health Association, July 17, 2025. ↩︎
- Physician Shortage in Rural Areas of the U.S. Worsened Since 2017, Barbara Ficarra, University of Rochester Medical Center, November 24, 2025. ↩︎
- “The Complexities of Physician Supply and Demand: Projections From 2021 to 2036,” Association of American Medical Colleges, March 2024. ↩︎
- Unmatched: Repairing the U.S. Medical Residency Pipeline, Robert Orr, Niskanen Center, September 20, 2021. ↩︎
- The Planning of U.S. Physician Shortages, Robert Orr, Niskanen Center, September 8, 2020. ↩︎
- While hospitals can and do fund additional residency slots through other means, Medicare’s cap means it does not automatically subsidize slots above each hospital’s 1996 level. Congress has authorized small increases since then. ↩︎
- Unmatched: Repairing the U.S. Medical Residency Pipeline, Robert Orr, Niskanen Center, September 20, 2021. ↩︎
- Implementing new licensing pathways that work for international doctors and American patients, Jonathan Wolfson, Lawson Mansell, and Katherine Hall, Niskanen Center, December 11, 2025. ↩︎
- “Medicare Graduate Medical Education, 2025,” Congressional Research Service, 2025. ↩︎
- “Revising Medicare’s indirect medical education payments to better reflect teaching hospitals’ costs,” Medicare Payment Advisory Commission, June 2021. ↩︎
- The IME adjustment is calculated as: 1.35 × [(1 + r)^0.405 − 1], where r represents the hospital’s ratio of full-time equivalent residents to available beds. Corresponds to a 5.5% increase to IME funding for a 10% increase to the resident to bed ratio. The multiplier 1.35 is set by Congress and has remained at this level since 2003. The resident-to-bed ratio is based on a 3-year rolling average of full-time equivalent resident counts, subject to the lesser of the current year’s count or the prior year’s count, divided by beds. ↩︎
- DGME = PRA x weighted FTE residents x Medicare inpatient day share. Residents in their initial residency period are weighted at 1.0; residents beyond their initial residency period are weighted at 0.5. For PRA purposes, primary care specialties are defined as family medicine, general internal medicine, general pediatrics, preventive medicine, geriatric medicine, and obstetrics/gynecology — these residents receive a higher PRA weighting than non-primary care residents. The Medicare inpatient day share is calculated as Medicare inpatient days divided by total inpatient days. ↩︎
- “Table C6: Physician Retention in State of Residency Training,” by State Association of American Medical Colleges, 2025. ↩︎
- Family Medicine Residencies: How Rural Training Exposure in GME Is Associated With Subsequent Rural Practice, Deborah J. Russell et al., Journal of Graduate Medical Education and American Board of Family Medicine, 2022. ↩︎
- Family Medicine Residencies: How Rural Training Exposure in GME Is Associated With Subsequent Rural Practice, Deborah J. Russell et al., Journal of Graduate Medical Education and American Board of Family Medicine, 2022. ↩︎
- “Investing in Primary Care: The Missing Strategy in America’s Fight Against Chronic Disease,” Milbank Memorial Fund, 2026. ↩︎
- Critical Access Hospitals (CAHs), which account for more than half of all rural hospitals, operate outside the IPPS system entirely and receive no IME payments. Their DGME is paid on a cost-based basis rather than through the formula this paper analyzes. The rural disadvantage documented here applies to rural hospitals within the IPPS system. CAHs represent a separate and arguably more acute access problem that the GME formula does not address. The recommendations in this paper to reorient current funding toward rural programs is in part due to this discrepancy. ↩︎
- “Revising Medicare’s indirect medical education payments to better reflect teaching hospitals’ costs,” Medicare Payment Advisory Commission, June 2021. ↩︎
- “Revising Medicare’s indirect medical education payments to better reflect teaching hospitals’ costs,” Medicare Payment Advisory Commission, June 2021. ↩︎
- “Graduate Medical Education: Information on Initial Distributions of New Medicare-Funded Physician Residency Positions,” Government Accountability Office, December 2025. ↩︎
- “Special Treatment: Hospitals Located in Urban Areas That Apply for Reclassification as Rural,” Code of Federal Regulations, title 42, sec. 412.103. ↩︎
- “FAQs on Section 127 of the CAA, 2021 Regarding Residents Training in Rural Track Programs (RTPs),” Center for Medicare and Medicaid Services, May 2024. ↩︎
- Yang Wang, Jared Perkins, Christopher M. Whaley, and Ge Bai, “Sharp Rise In Urban Hospitals With Rural Status In Medicare, 2017–23,” Health Affairs 44, no. 8, August 4, 2025. ↩︎
- Unmatched: Repairing the U.S. Medical Residency Pipeline, Robert Orr, Niskanen Center, September 20, 2021. ↩︎
- Gottlieb, Joshua D., and Sean Nicholson. 2026. “Physician Competition: Entry and Substitution.” Journal of Economic Perspectives 40 (2): 117–142. ↩︎
- Gottlieb, Joshua D., and Sean Nicholson. 2026. “Physician Competition: Entry and Substitution.” Journal of Economic Perspectives 40 (2): 117–142. ↩︎
- “The 2023 Internal Medicine Fellowship Match,” James Allen, MD, 2023. ↩︎
- Allan H. Goroll, “Primary Care Internal Medicine is Dead — Long Live Primary Care Internal Medicine,” Journal of General Internal Medicine, March 9, 2023. ↩︎
- The Health of U.S. Primary Care: 2024 Scorecard Report,” Milbank Memorial Fund, 2024. ↩︎
- “What Are the Recent Trends in Health Utilization and Spending?” Peterson-KFF Health System Tracker, 2024. ↩︎
- Edward Salsberg et al., “US Residency Training Before and After the 1997 Balanced Budget Act,” JAMA, September 10, 2008; “ACGME Releases 2024-2025 Statistics on Graduate Medical Education Programs and Resident Physicians,” Accreditation Council for Graduate Medical Education, October 2024. ↩︎
- “Physician Workforce: Caps on Medicare-Funded Graduate Medical Education at Teaching Hospitals,” U.S. Government Accountability Office, May 2021. ↩︎
- “Physician Workforce: Caps on Medicare-Funded Graduate Medical Education at Teaching Hospitals,” U.S. Government Accountability Office, May 2021. ↩︎
- Thomas J. Mohr, Written Statement Before the House Ways & Means Health Subcommittee, February 2026. ↩︎
- “Be careful with resident rotators: What you don’t know might hurt your hospital’s ability to receive Medicare GME payments in the future,” Dentons, 2015. ↩︎
- “AAMC Publishes Analysis on Hospital GME PRA and FTE Cap Reset Policy,” Association of American Medical Colleges, November 21, 2025. ↩︎
- “Cassidy, Cortez Masto, Cornyn, Bennet Introduce Bipartisan Draft Legislation to Help Teaching Hospitals Train More Doctors,” Office of Senator Bill Cassidy, 2024. ↩︎
- Lawson Mansell and Jared Rhoads, “Evaluating a New Senate Proposal to Reform Residency Funding,” Niskanen Center, January 29, 2025. ↩︎
- “Health Subcommittee Hearing on Advancing the Next Generation of America’s Health Care Workforce,” House Ways & Means Committee, February 2026. ↩︎
- Lawson Mansell, “Congress Is Asking the Right Questions About America’s Doctor Shortage,” Niskanen Center, 2026. ↩︎
- That said, CMS has meaningful administrative flexibility through the Center for Medicare and Medicaid Innovation (CMMI) to pilot payment reforms that could inform and help accelerate legislative action. CMS and CMMI should use that authority to test alternative payment models for GME, particularly around outpatient IME adjustments and need-based payment differentials, while Congress works toward more comprehensive reform. ↩︎
- Please see our methodological appendix for additional information on the calculations for each model. ↩︎
- “Revising Medicare’s indirect medical education payments to better reflect teaching hospitals’ costs,” Medicare Payment Advisory Commission, June 2021. ↩︎
- Under our proposal, we shift the current multiplier which is exclusively IPPS (=1.35x) toward OPPS, so that the multiplier would be IPPS .95x, OPPS 0.50x. ↩︎
- “Revising Medicare’s indirect medical education payments to better reflect teaching hospitals’ costs,” Medicare Payment Advisory Commission, June 2021. ↩︎
- Slot-equivalent funding is based on DGME costs and may represent a lower bou ↩︎
- Lawson Mansell and Jared Rhoads, “Evaluating a New Senate Proposal to Reform Residency Funding,” Niskanen Center, January 29, 2025. ↩︎
- “AAMC Publishes Analysis on Hospital GME PRA and FTE Cap Reset Policy,” Association of American Medical Colleges, November 21, 2025. ↩︎