
Key Takeaways
- Over the past 25 years, there has been a growing divide between states with broader, indexed taxable wage bases for their unemployment insurance (UI) programs and the states applying narrower taxable wage bases.
- Indexed states have applied UI taxes to a consistent share of total state wages, while nonindexed states have experienced a significant erosion in coverage. The application of higher tax rates in nonindexed states has not made up for the narrower taxable wage base levels. Relative to the size of their economies, nonindexed states raise lower levels of program revenue than indexed states.
- Indexed states have been able to offer more generous benefit levels while building up more robust trust funds, on average. Despite modest declines in the proportion of average wages insured by UI, nonindexed states remain less prepared for their programs’ highest cost years.
- A subset of nonindexed states make automated, minor adjustments to their program wage bases according to the UI trust fund level. Although these particular states avoided trust fund shortfalls comparably well in the 2000s, the continued erosion of their wage bases has put them increasingly at risk. By the mid 2010s, the ability of these states to raise revenue mirrored nonindexed states fully reliant on their legislatures to adjust the UI taxable wage base.
- By setting the taxable wage base equal to a stable share of the average state wage, nonindexed states can minimize risk of insolvency. Indexation helps states maintain existing UI benefit adequacy while improving the fiscal sustainability of their programs.
Introduction
Anyone managing their household’s pocketbook knows to track two key numbers: how much is being spent and how much is being saved. Technically, you can spend all the income you earn each month without immediately going into debt, but unexpected expenses happen. The safer route is to save a steady portion of your paychecks and build up the reserves to cover a sudden surge in cost.
States must manage their unemployment insurance programs in a similar manner. Unemployment taxes bring in the necessary revenue that states use to pay benefits to temporarily unemployed workers. They need to collect enough tax revenue to finance current benefit claims and build up sufficient reserves for their UI trust fund to prepare for recessions. Yet states have struggled to reinforce their trust funds, leaving their programs vulnerable when economic downturns hit. Benefit costs can quickly overwhelm states, pushing their programs into debt and forcing them to rely on federal loans to make regular UI payments to rising numbers of claimants. UI trust fund insolvency has consequences for workers and businesses alike, and digging out of the hole can be difficult.
A sizable number of states continue to hold weak trust fund reserve levels, leaving them vulnerable to insolvency in the event of a sudden economic downturn. This report explores a key reason why some states are experiencing these fiscal shortfalls: narrow taxable wage bases.
Each state maintains a taxable wage base for its program, which is the amount of an employee’s wages on which an employer typically pays UI taxes. Not surprisingly, states with broader taxable wage bases tend to have more robust UI trust funds, other conditions being equal. Over the past quarter of a century, there has been a growing divergence between narrow and broad wage base states, with wage base indexation a critical factor. Despite applying higher tax rates, states with narrow, stagnant wage bases tend to have more financial difficulties than states with broader wage bases that automatically keep up with wage growth via indexation. Most narrow wage base states forgo indexing and instead rely exclusively on their legislatures to act. They raise less program revenue relative to the size of their economies, deal with program insolvency more often, and take longer to pay off UI debt obligations, all while paying less generous benefit levels.
These financial difficulties often translate into spikes in federal taxes for businesses during economic recoveries and lead states to enact benefit cuts for workers. Required interest payments to the federal government for UI program loans can also crowd out other immediate state priorities. Some states have responded with laws automatically raising the taxable wage base when trust fund levels get too low. The trust fund performance of those states has gotten worse as their UI wage bases have eroded as a proportion of total wages.
There is a more durable way for states to fix the imbalance between the moderate benefits paid out and the tax contributions brought in.1 To help achieve program stability, narrow wage base states can 1) bring their UI wage base closer in line with the average state wage; and 2) automatically adjust the wage base amount for wage increases over time.
Insolvency is an ongoing concern
A significant number of state UI programs have been unable to cover the cost of benefits paid out to eligible workers while also building up reserves. By the end of 2020, 17 states had outstanding federal loans. These states borrowed because their UI trust funds no longer held sufficient reserves to continue paying out regular benefits. More states likely would have followed suit if not for Covid-19 recovery funds provided by Congress. Although most state balance sheets are now positive and improving, the risk of program insolvencies remains a pressing concern moving forward.2
States have struggled to finance their unemployment programs before. Recessions in the early 1980s and late 2000s wiped out the cumulative reserves across state programs.3 The impact of the Great Recession of 2007–2009 was especially severe. A majority of states took out federal loans, and 22 faced federal tax penalties.4 It then took time to pay back the federal government, leading states to enter the pandemic with fragile trust fund balances. California, in particular, did not resolve its program debt until 2018 and once again owes billions of dollars in loan repayments plus interest that will take years to pay off.5 It is not surprising that the Golden State’s taxable wage base is tied for lowest in the nation.6
Employers and workers both suffer financial setbacks when state UI programs become insolvent. Businesses in insolvent states often must shoulder sharp increases in their state and federal unemployment tax rates, and may need to pay the interest accruing on federal loans taken out to cover benefit payments. Meanwhile, indebted states have repeatedly enacted benefit cuts, or frozen benefit increases, adding hardship to unemployed workers and leading to lower salaries in their next jobs.7 “In the long run, the status of a state’s reserves is bound to affect its attitude toward the relative adequacy of its benefit provisions,” economists William Haber and Merrill G. Murray noted in 1966. “It is therefore important to have an adequate reserve in order that adequate benefits will be enacted.”8 Contemporary researchers have reached similar conclusions. Alex Hertel-Fernandez, for example, found that weak trust fund solvency hampers “the UI system’s ability to provide economic security to workers and stabilization to the economy during downturns” and “prevents legislators from enacting expansions that would otherwise be needed to keep UI benefits in line with changes in the economy and the labor force.”9
Department of Labor analytics indicate most states are not raising enough revenue now to prepare their trust funds for future recessions, just as in 2019.10 Without action, states with narrow wage bases will be especially prone to insolvency. States generating program revenue from a declining share of total wages have little financial margin for error, whether recent benefit increases have been enacted or not.
Benefit reductions adopted in the past
This section of the report lays out how states with insolvent programs have adjusted their unemployment benefit generosity in the past — by reducing the typical benefit size, limiting the maximum possible duration of benefits, and raising the amount of prior earnings required to be eligible for benefits.
There are two common ways that states cut UI benefits: lowering the wage replacement rate and/or reducing the generosity of the maximum weekly benefit amount, either by lowering the maximum weekly payment size or freezing it for an extended period.
The wage replacement rate is the percentage of prior earnings that a state covers via weekly unemployment insurance benefits. A state with a wage replacement rate of 50 percent replaces half of a worker’s weekly wages earned in their previous job. (Note: those qualifying are guaranteed a minimum benefit amount.) Lowering the wage replacement rate hurts claimants qualifying for more than the minimum weekly benefit amount, including some workers who otherwise would have received the maximum weekly benefit amount.
The maximum weekly benefit amount is the largest benefit that a state offers to claimants. A worker will have a set percentage of their prior wages replaced until they reach the maximum benefit amount. Shrinking the maximum benefit hurts middle-income workers by limiting the proportion of previous wages covered by UI.11 Freezing the maximum benefit amount can have a similar effect over time as average wages increase.
States may opt to limit the costs of paying UI benefits by cutting the maximum number of weeks that claimants can receive benefit payments.12 Workers are commonly eligible for up to 26 weeks of benefits, but some state policymakers have opted to lower the total to address fiscal shortfalls. After the Great Recession, the Government Accountability Office (GAO) found that the nine states that reduced the maximum benefit-week amount “were more likely to have federal loans as their UI reserves became depleted” and that “officials in five of the nine states said that replenishing their trust fund balance was a key rationale for reducing benefit duration.”13
The strictest states now cap the total number of benefit weeks at under 13.14 This has led workers to have less time to find a job for which they are well-suited before their insurance runs out.
In addition to directly altering the benefit generosity, states may decide to make it harder for workers to qualify for benefits in the first place. This is commonly done by raising the amount of earnings needed to qualify for benefits. Monetary eligibility is typically based on wages earned in the first four of the five most recently completed calendar quarters, known as the standard base period. Most states also provide an alternative base period for eligibility that focuses on the four most recent calendar quarters. Workers must have accumulated enough earnings across those calendar quarters (or worked enough hours in the case of Washington state). States may also require a minimum amount of wages in a single quarter or earnings to be spread out across multiple quarters.15 States can further tighten these monetary criteria to limit the number of unemployed workers claiming benefits.
While states have frequently addressed insolvency through these benefit-side restrictions, such cuts create hardship for unemployed workers without addressing UI trust funds’ underlying revenue problems. A more sustainable approach focuses on the revenue side of the equation, particularly by reforming how unemployment taxes are structured and collected.
Tax features for policymakers to consider
There are compelling reasons for lawmakers to prioritize tax-side reforms over benefit-side adjustments to enhance program solvency. Benefit cuts make it harder for unemployed individuals to afford the time required to search for and secure quality jobs. Moreover, larger benefits are not primarily responsible for worse program solvency. UI tax reforms that generate new revenue have had a stronger connection to program solvency, especially changes made to the proportion of wages subject to unemployment taxes.16
Although some have attributed trust fund shortfalls to excessive and growing benefit amounts, benefit levels have remained relatively stable as a proportion of wages in recent decades. At the same time, the share of wages that are subject to state unemployment taxes has declined substantially more on net — a dropoff that has depreciated revenue levels. The GAO made similar observations in the aftermath of the Great Recession, concluding that
“Long-standing UI tax policies and practices in many states over 3 decades have eroded trust fund reserves, leaving states in a weak position prior to the recent recession. While benefits over this period have remained largely flat relative to wages, employer tax rates have declined. Specifically, most state taxable wage bases have not kept up with increases in wages, and many employers pay very low tax rates on these wage bases…”17
Lawmakers should understand the negative impact of benefit-side cuts on workers. Moving forward, states should take the appropriate fiscal steps to avoid these benefit reductions and figure out how to reliably raise more revenue instead.
The remainder of this section of the report lays out the three main ways that states can adjust their unemployment taxes — namely, the tax rates that employers typically face; the tax schedules that provide the range of possible tax rates; and the state taxable wage base, which is the total amount of wages from each covered employee that are subject to UI taxes. The taxable wage base has been the policy lever with the greatest impact on UI program solvency.18 Each state can and does design these features in distinct ways within the constraints of federal law.
Employer tax rate
Every state assesses unemployment taxes on employers to finance its UI program. Only three states — Alaska, Pennsylvania, and New Jersey — apply an employee-side UI tax to supplement the employer-side taxes.19
Federal law requires that every state apply a maximum tax rate of at least 5.4 percent for employers in order to qualify for the 5.4 percent Federal Unemployment Tax Act (FUTA) credit.20 Besides this rule, states can choose the range of possible rates that employers face. States may allow employers to pay tax rates as low as 0 percent, while the highest possible rates can exceed 10 percent. And in fact, no state has adopted a flat rate of 5.4 percent. Employers’ unemployment tax rates in all states are therefore experience rated: States assign each employer a tax rate based on how frequently former employees claim UI benefits. The rate is then applied to the state wage base for each employee on the payroll to determine the total UI taxes owed.
An employer’s experience rating — the tax rate it pays, typically based on its history of former employees claiming UI benefits — is generally calculated according to either an employer-specific reserve ratio or benefit ratio.21 States using the reserve ratio method tax employers with lower program balances at higher rates, and tax those with greater net contributions at lower rates, adjusting for the size of the business. States using the benefit ratio method base the employer tax rates according to the amount of benefits claimed by separated workers in recent years relative to the total payroll.22 States assign new employers a set rate to start off, with new construction businesses often facing higher rates.
In most states, an employer’s experience tax rating is determined using a fixed-interval scale, which assigns tax rates based on set reserve or benefit ratio levels. There is no limit to the number of employers that can pay low UI tax rates if few former workers claim UI benefits. This dynamic can limit the growth of trust fund reserves before crises strike. The remaining 12 states use an array method, in which employers are ranked against one another, and a set proportion of businesses are sorted into tax-rate categories in the tax schedule.23 This approach can generate more predictable annual revenue.24
Experience rating has several key drawbacks. The risk of increased taxes can discourage employers from taking chances on workers with shorter or spottier job histories, even if they may be a good fit for roles.25 Some employers unfairly obstruct their workers from claiming UI benefits in order to avoid paying higher taxes.26 Experience rating can also be a drag on postrecession recoveries as businesses’ UI tax rates rise due to recent layoffs.27 As a result, reforms that minimize the variability of rates in exchange for a broader taxable wage base may be preferable.28
Tax schedule
The tax schedule is the range of possible employer tax rates. States may apply different tax schedules depending on the status of their trust funds. States may use tax schedules with lower rates when their trust funds have a larger balance; a smaller balance could shift the tax schedule upward. Even employers with consistent rates of layoffs over time may see their tax rates go up or down in response to a change in the schedule.
States structure their least favorable (higher rate) and most favorable (lower rate) tax schedules in different ways.29 Shifting to a less favorable tax schedule may raise the minimum and maximum tax rates that employers can face, although states may only increase the maximum or the minimum tax rate. Some states do not adjust either and apply the same range of rates no matter the condition of its trust fund.
When the economy is stronger and layoffs fewer, a larger proportion of employers may face rates as low as 0 percent due to the use of a low tax schedule. Such low rates can make it difficult for states to build up sufficient reserves to weather a downturn, although insolvency is possible even when the highest tax schedule is applied. Consider the fact that California has applied its highest tax schedule for two decades.30 Higher UI tax rates imposed on employers have failed to prevent program insolvency in the two recessions over the recent twenty-year period, in large part because so few wages are taxable.31
Taxable wage base
Each state applies a UI taxable wage base that matches or exceeds the federal minimum of $7,000, which was last updated in 1983. Applying the federal minimum standard means that only $7,000 of each employee’s annual wages are subject to UI taxes. The federal unemployment tax, referred to as FUTA, sets this baseline.32
FUTA is used to finance program administration and the federal share of emergency benefit weeks when the unemployment rate is high. Although FUTA is a 6.0 percent tax that employers must pay on the first $7,000 of each employee’s wages, the effective rate paid is usually 0.6 percent. Employers in states that follow the federal guidelines for their UI programs receive a 5.4 percent credit against the original rate, a significant incentive to set the state wage base at $7,000 or above. States have substantial flexibility in setting their taxable wage bases otherwise.33
In 2025, states set a median taxable wage base of $14,000. Forty-six states and the District of Columbia have raised their UI wage base above the $7,000 FUTA minimum; only Arkansas, California, Florida, and Tennessee remain at the federal minimum. Alaska, Hawaii, Idaho, Minnesota, Montana, Nevada, New Jersey, North Dakota, Oregon, Utah, and Washington state apply the broadest wage bases, each exceeding $40,000. All else being equal, the higher the wage base, the more revenue the tax generates for a state’s unemployment trust fund. States’ divergent approaches to updating their wage bases have resulted in a wide gap between the lowest and highest wage bases.
There are three main approaches by which states update their UI wage base. As of 2025, 22 states have passed laws to automatically index their wage bases. Indexed states generally have their wage base amounts move higher in tandem with increases to the average state wage. Eight states use a trigger that automatically adjusts their wage base in response to rising or falling state UI trust fund levels.34 The wage base rises when the fund is in worse shape, and falls when the reserves are more robust. Twenty states and the District of Columbia continue to leave the decision to the state legislature.
Trigger and legislature states have much more narrow wage bases than indexed states. Half of total wages in indexed states are subject to UI taxes compared with only around 20 percent of wages in trigger and legislature states, down from 30 percent in 2000. Nonindexed states have failed to update their wage bases to keep pace with average wage increases, shifting a greater relative share of UI benefit financing onto low- and middle-wage employers. Nonindexed states apply higher tax rates, on average, but raise less program revenue relative to the size of their economies than the indexed states. Critically, indexed states have been more successful at raising revenue because their wage bases were sufficiently broad when indexed.
Key taxable wage base trends
Early on in the UI system’s existence, the federal government played an active role in elevating states’ taxable wage base standards. That is no longer the case. Almost every program now has a higher taxable wage base than the federal minimum.35 States have become solely responsible for adjusting their programs’ wage bases over time, leading to the varying approaches.
A stagnant federal wage base
U.S. policymakers have been concerned about program insolvency since the UI system was established as part of the Social Security Act of 1935. Those designing the original federal statutes were “cognizant of the large debt accumulated in the 1920s by the British unemployment insurance fund” and “extremely cautious as to the income-outgo relationship between contributions and benefits.”36 Finding the right balance was key, and program architects chose to tax a set proportion of earned wages to help ensure trust funds were ready for emergencies.
State trust funds became robust in the early years of the UI program, due in no small part to strong federal wage base standards. A fixed percentage of wages was taxed in the early years of the program. By 1938, a 3 percent federal tax on total payroll was applied, with rate reductions based on states’ tax contributions that employers paid.37 Soon after, Congress changed the taxable wage base from all covered payroll to the first $3,000 of wages for each worker. This new total applied to over 90 percent of covered wages and mirrored the tax base for Social Security.38
However, the federal UI wage base has fallen well behind that of Social Security. Congress automatically indexed the Social Security base to wage increases in 1972, but has only raised the federal UI wage base amount three times since 1940.39 Social Security’s taxable wage base has steadily increased to $176,100 in 2025; the federal UI wage base has remained at $7,000 since 1983.40 Twenty percent fewer wages are subject to UI taxes today. The federal baseline has become vestigial – it may have ensured proper trust fund balances in states 40 years ago, but not today.
Without regular updates to the federal standard, more UI programs have incurred debt in recent decades. Program outlays have risen as wages have gone up, regardless of whether benefit generosity has been increased or left untouched. It has been up to states to raise their taxable wage bases.
States indexing their wage bases
Figure 1: Timeline of state UI wage base indexation
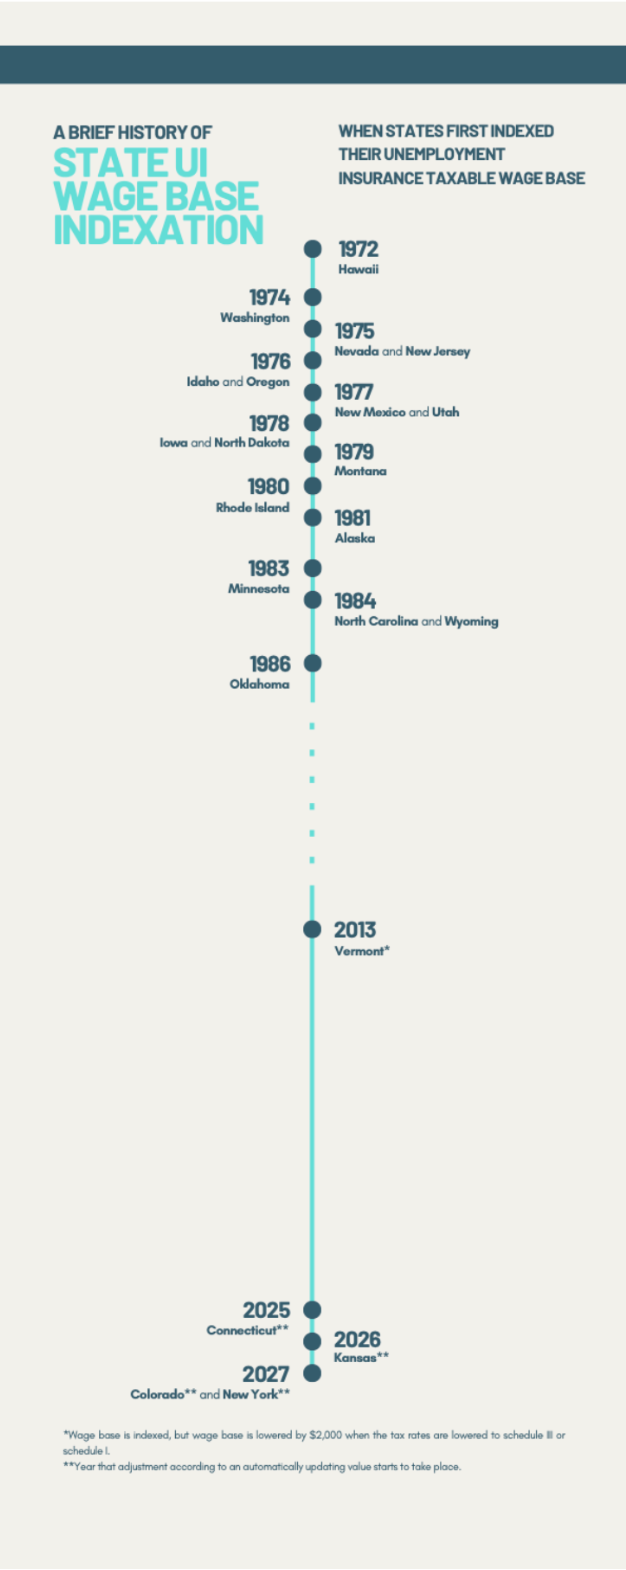
Starting in the 1970s, there was growing recognition among states that their trust funds were fragile. Half of states had indexed their maximum weekly benefit levels by 1971, with another 10 following soon after.41 But states’ taxable wage bases were static and no longer sufficient to cover the growing program cost.
In response, 17 states opted to index their UI taxable wage bases between 1972 and 1986. The timeline in Figure 1 shows when states made the changes. A common method was to set the wage base equal to a set percentage of the average state wage. As wage levels and benefit sizes grew, so would the taxable wage base.
Only five states have indexed their wage bases since 1986. Vermont began indexing in 2013, although its wage base is automatically lowered by $2,000 when the tax schedule is reduced.42 The other states — Connecticut, Kansas, Colorado, and New York — only recently enacted laws to index their wage bases, largely to address solvency concerns stemming from the Covid-19 pandemic.43
The rest of the states still choose not to index. Twenty states and Washington, D.C., continue to leave it to their legislatures, and eight apply triggers that adjust in accordance with trust fund levels. Louisiana became a trigger state in 1995, while the other seven in this group scheduled theirs to take effect between 2009 and 2020. Appendix A shows the years that state trigger laws were fully implemented.
There are stark differences between the wage bases and benefit generosity of indexed states compared with the nonindexed states. Indexed states apply their UI taxes to a greater proportion of state wages, and their weekly UI benefits replace a greater percentage of prior wages. Trigger and legislature states have opted for smaller wage base coverage and wage replacement, which have both narrowed over the past 25 years.
Figure 2: Average percent of state wages covered, by type of state wage base adjustment
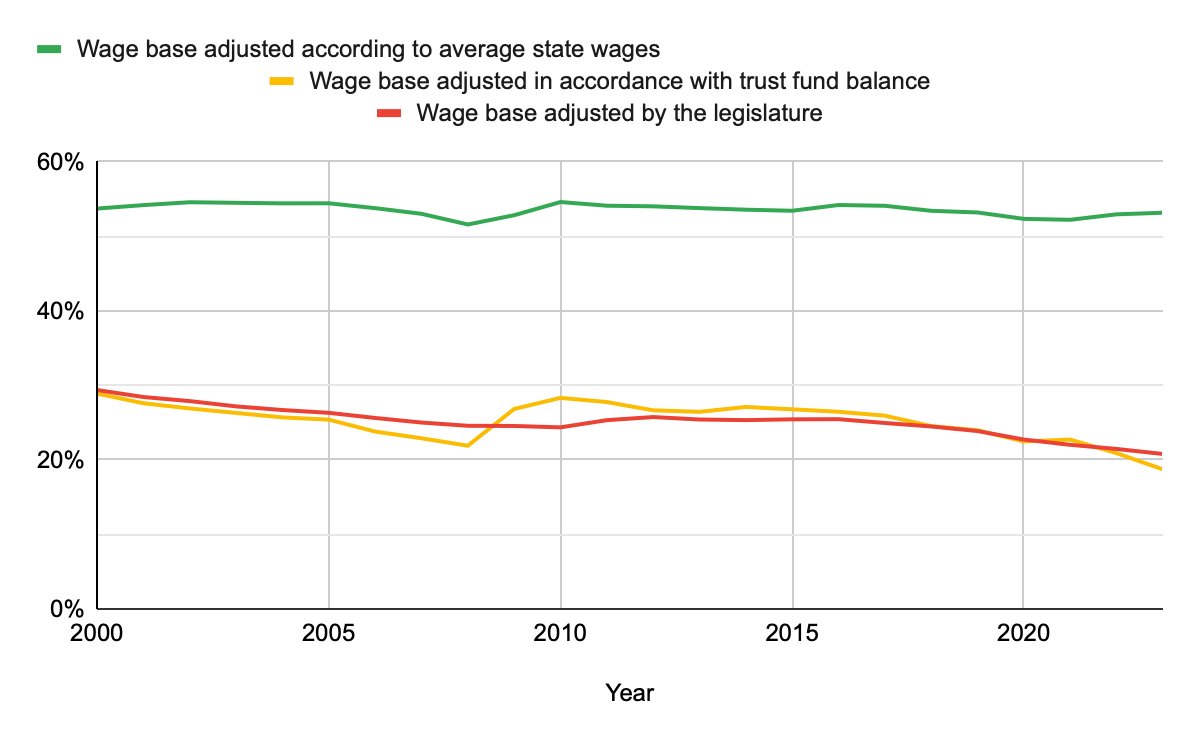
Data source: U.S. Department of Labor.
The average wage base in indexed states has doubled between 2000 and 2023, from around $20,000 to $40,000, and consistently covers over half of total wages. These states have continued to replace 40 percent of average wages. In contrast, legislature and trigger states’ wage bases have largely remained around $10,000, and now apply to about 20 percent of total state wages versus 29 percent in 2000. This wage base decline has been more extreme than the erosion in nonindexed state benefit levels. Nonindexed states replaced around 34 percent of average state wages in 2000, whereas trigger and legislature states typically cover 28 percent and 30 percent levels now.
Table 1: Indexed states have seen stable wage bases and benefit levels, unlike trigger and legislature states
| Wage base adjustment type in 2023 | Ratio of Taxable to Total Wages in 2000 | Ratio of Taxable to Total Wages in 2023 | Relative change in the ratio | Ratio of Average Weekly Benefit Amount to Average Weekly Total Wages in 2000 | Ratio of Average Weekly Benefit Amount to Average Weekly Total Wages in 2023 | Relative change in the ratio |
| Indexed | 52.5% | 53.2% | 1.3% | 39.7% | 39.5% | -0.7% |
| Trigger | 29.3% | 18.7% | -35.0% | 34.8% | 27.6% | -20.7% |
| Legislature | 29.3% | 20.8% | -29.7% | 34.0% | 30.2% | -11.3% |
Data source: U.S. Department of Labor
As discussed later, stable taxable wage base coverage, as a percent of total wages, has allowed indexed states to pair reasonable benefit levels with a lower risk of insolvency. In contrast, less generous benefits have failed to reinforce program solvency in nonindexed states with narrow wage bases. Nonindexed states face ongoing fiscal issues because they have neglected their eroding taxable wage bases.
Indexation preserves state unemployment tax coverage over time
Wage base indexation helps to stabilize the proportion of wages in covered employment subject to taxation. States with indexed wage bases have typically set the base value as a percentage of the average state wage, ranging from 40 percent to 80 percent of that level.44 As wages increase in a state, the taxable wage base goes up by a similar amount. No further action is required.
Indexed states have seen the least amount of wage base erosion over time. Figure 3 shows the percentage-point change in total wages covered by UI taxes in each state from 2000 to 2023. Green circles represent states with indexed wage bases, yellow triangles represent states using wage base triggers, and red squares represent states reliant on their legislature. The type of wage base adjustment shown reflects each state’s approach at the end of 2023.
Figure 3: Percent of absolute change in total wages covered by UI taxes since 2000
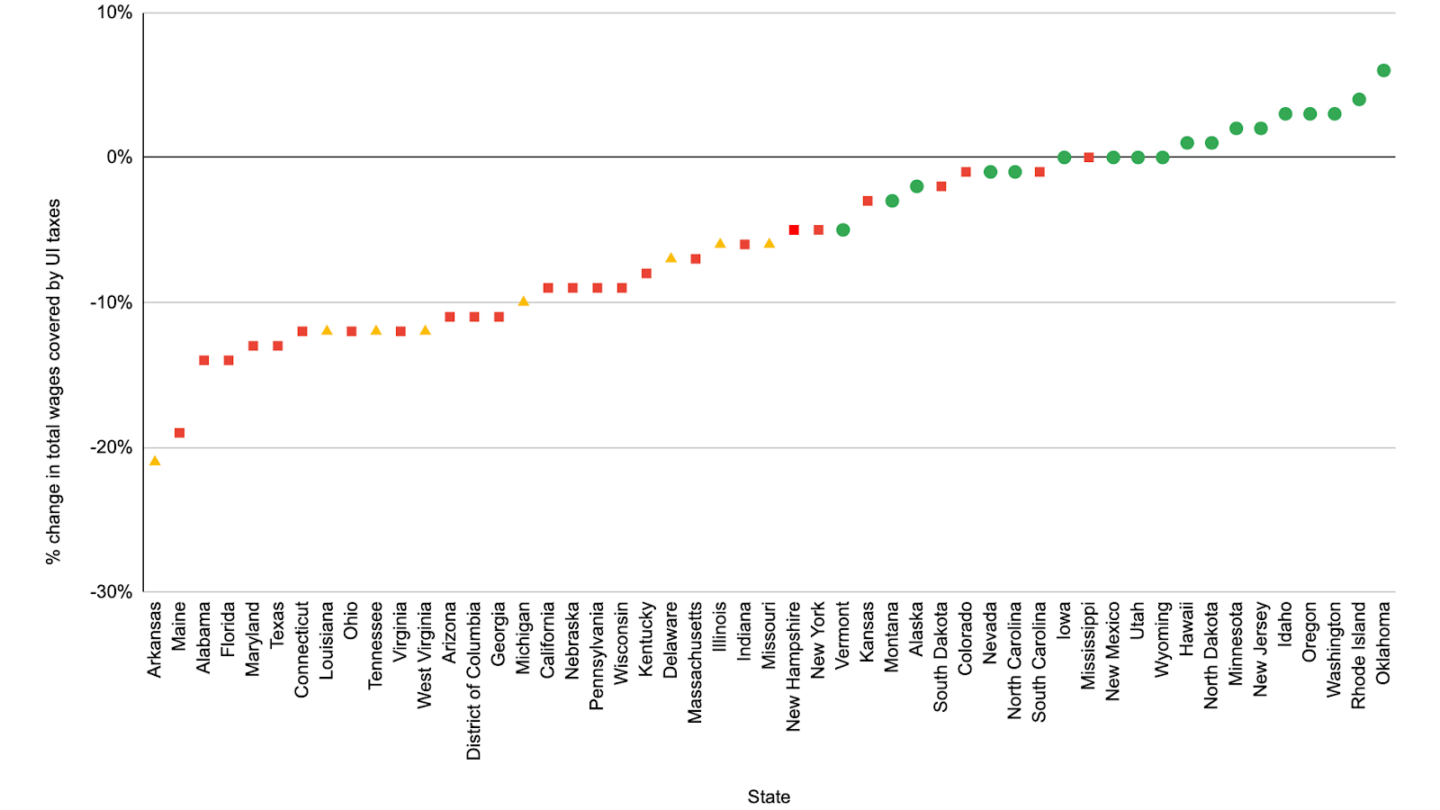
Data source: U.S. Department of Labor
Note: States are listed as indexed, trigger, or legislature states according to their 2023 status. Connecticut had its indexation law in full effect as of 2025. Kansas has its law in full effect as of 2026. New York and Colorado have their indexation laws in full effect as of 2027. Those states are treated as legislature states given that their indexation laws have not been fully rolled out. Vermont’s wage base has been indexed since 2013, but it is decreased by $2,000 when the tax schedule is lowered to certain levels.
Eighteen of the top 25 states with the least decline or a net increase in total UI-covered wages have indexed their wage bases. These states are located in all regions of the country. The largest decline among indexed states was Montana’s 3 percentage point drop; Oklahoma’s 6 percentage point increase was the biggest growth. A majority of indexed states saw either no change or positive change, with the average being a 1 percentage point increase.
Almost every state reliant on its legislature or trust fund triggers saw a decline in the proportion of total wages covered by state unemployment taxes. Arkansas and Maine dropped 21 percentage points and 19 percentage points respectively, the largest among all states. The only nonindexed state avoiding a reduction was Mississippi, where legislators doubled the taxable wage base from $7,000 to $14,000 in 2011. There has been wage base erosion since then, but the proportion of total wages that are taxable in Mississippi only just dropped to the level seen in the early 2000s. On average, legislature states saw a 9 percentage point decrease, and trigger states saw an 11 percentage point decrease.
With fewer taxable wages available, nonindexed states must apply larger tax rates to bring in revenue comparable to states with indexed wage bases. Figure 4 presents the average tax rate contributed by employers according to the type of state wage base adjustment. The trend lines are aggregate averages for states in each category. Trigger and legislature states have tended to apply higher average tax rates than indexed states.
Figure 4: Average tax rate contributed by employers, according to type of state wage base adjustment
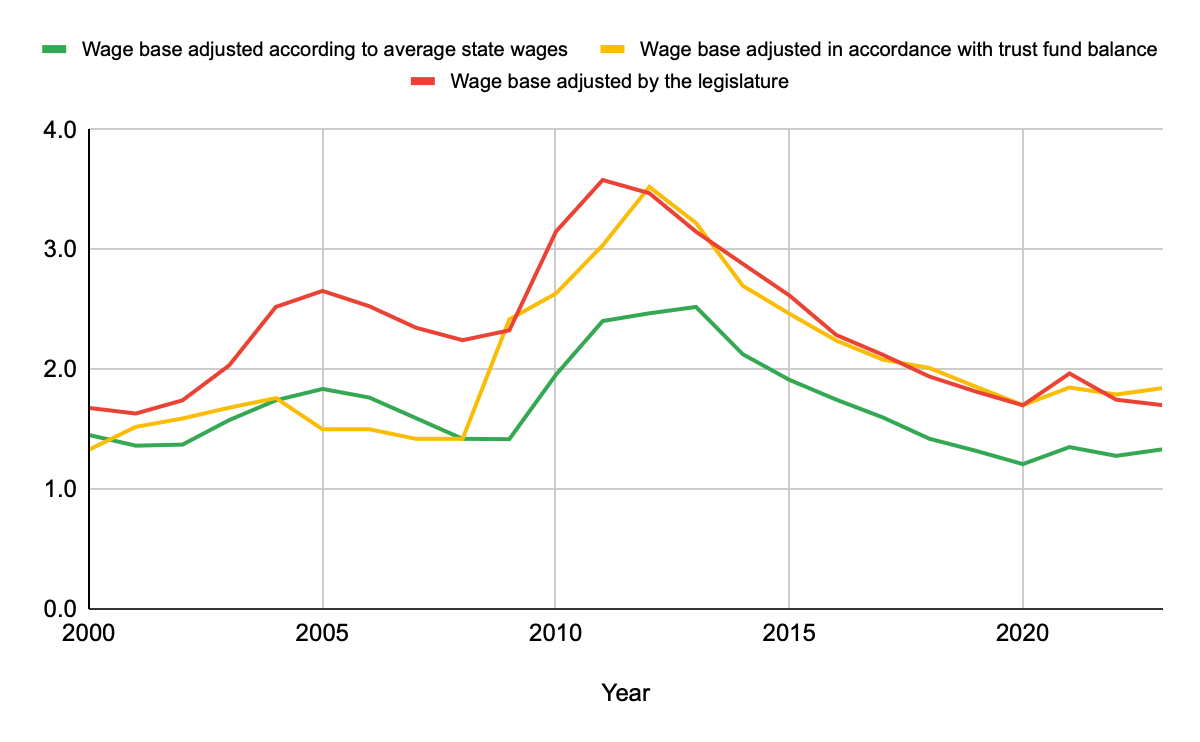
Data source: U.S. Department of Labor.
Note: States are listed as indexed, trigger, or legislature states according to their status in each given year.
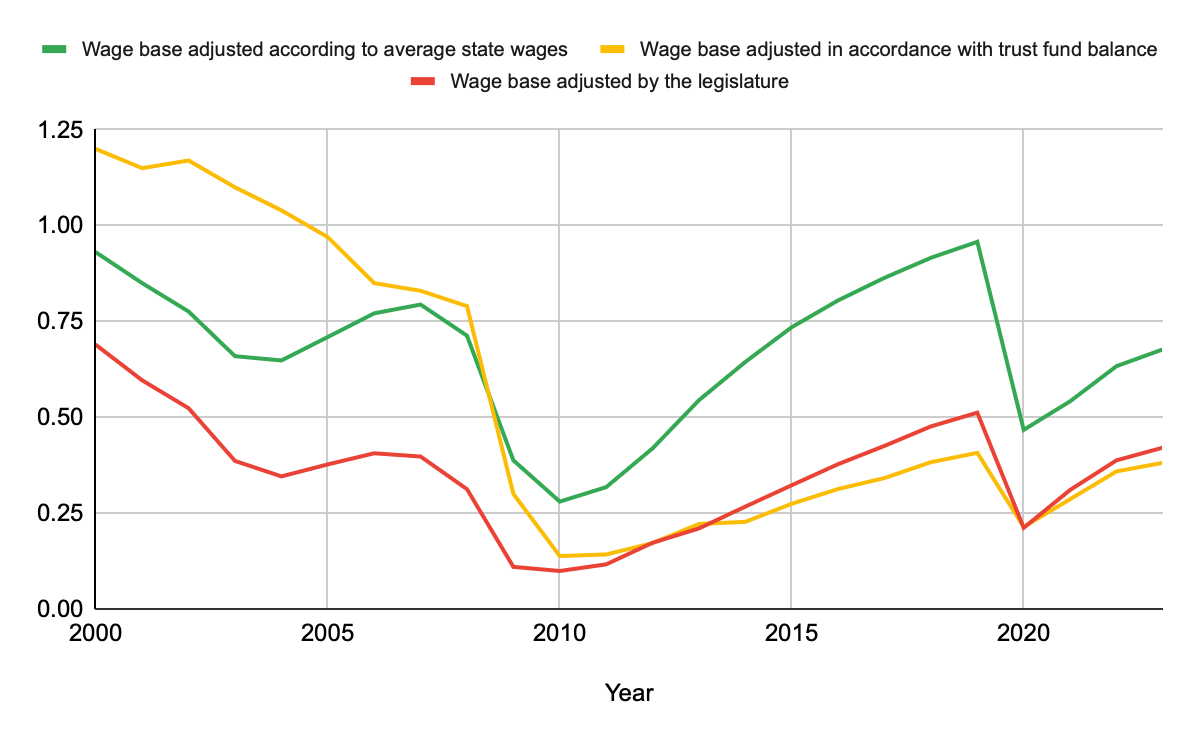
Despite using higher average tax rates, nonindexed states have failed to raise as much revenue. This difference is visible in Figure 5, which shows the percent of total wages contributed as unemployment taxes by employers according to the type of state wage base adjustment. Each year this century, employers have contributed a greater percentage of total wages as unemployment taxes in the average indexed states than in the average nonindexed state.
Figure 5: Percent of total wages contributed by employers, according to type of state wage base adjustment
Data source: U.S. Department of Labor.
Note: Many states used emergency flexibilities to avoid assigning high experience rating levels to employers for benefits claimed during the pandemic period, contributing tax rates remaining low in the years after 2020. See: Suzan G. Levine, Unemployment Insurance Program Letter No. 13-20, Change 3 (Washington, D.C.: U.S. Department of Labor, 2021).
In general, the percentage of taxable (Figure 4) and total wages (Figure 5) employers contribute in indexed and nonindexed states move in parallel as national economic conditions change. The average rates on taxable and total wages for trigger states appear to adjust in a slightly different manner in the latter-2000s as seven legislature states began to join Louisiana in this category. Separate from that, businesses in all states face higher rates when unemployment rises and claims increase, and experience lower rates when the economy is strong.
The primary difference between these categories of states is that those with indexed wage bases bring in more program revenue relative to the size of their economies. Over the past decade, once seven of eight trigger states had fully implemented their trigger laws, nonindexed states tended to use tax rates that were 0.5 percentage points higher over time (Figure 4), but employers in those states contributed 0.3 percentage points less of total wages as unemployment taxes than indexed states, on average (Figure 5). Another way to put it: Nonindexed states raised around three-fifths of the revenue levels of indexed states, once adjusting for the size of each state’s economy.
This revenue disparity has increased the trigger and legislature states’ risk of insolvency and reliance on federal loans. (Technical information on the federal loan system is detailed in Appendix B.) Nonindexed states have struggled relative to indexed states to build up reserves in good economic conditions despite less generous benefit amounts.
Indexed states’ trust funds perform better in recessions
Whether or not a state’s trust fund is recession ready depends on the robustness of reserves. Because nonindexed states bring in lower levels of revenue in a given year due to their narrow wage bases, they are more vulnerable to program insolvency compared with states with broad, indexed wage bases. In general, indexed states with broad wage bases avoid similar shortfalls without policymakers needing to do anything.
Three key indicators confirm this dynamic for the three recessions since 2000 (early-2000s recession, the Great Recession of 2007–2009, and the recession during the Covid-19 pandemic). First, state program performance can be measured according to the reserve ratio, which is the trust fund level in relation to total wages in a state for covered employment. Second, each state’s reserve ratio can be benchmarked against its highest cost benefit year, a metric known as the high cost multiple. Lastly, states can be assessed according to their federal loan reliance, the frequency and duration of time that states require federal loan assistance. Whichever way performance is measured, indexed states do better.
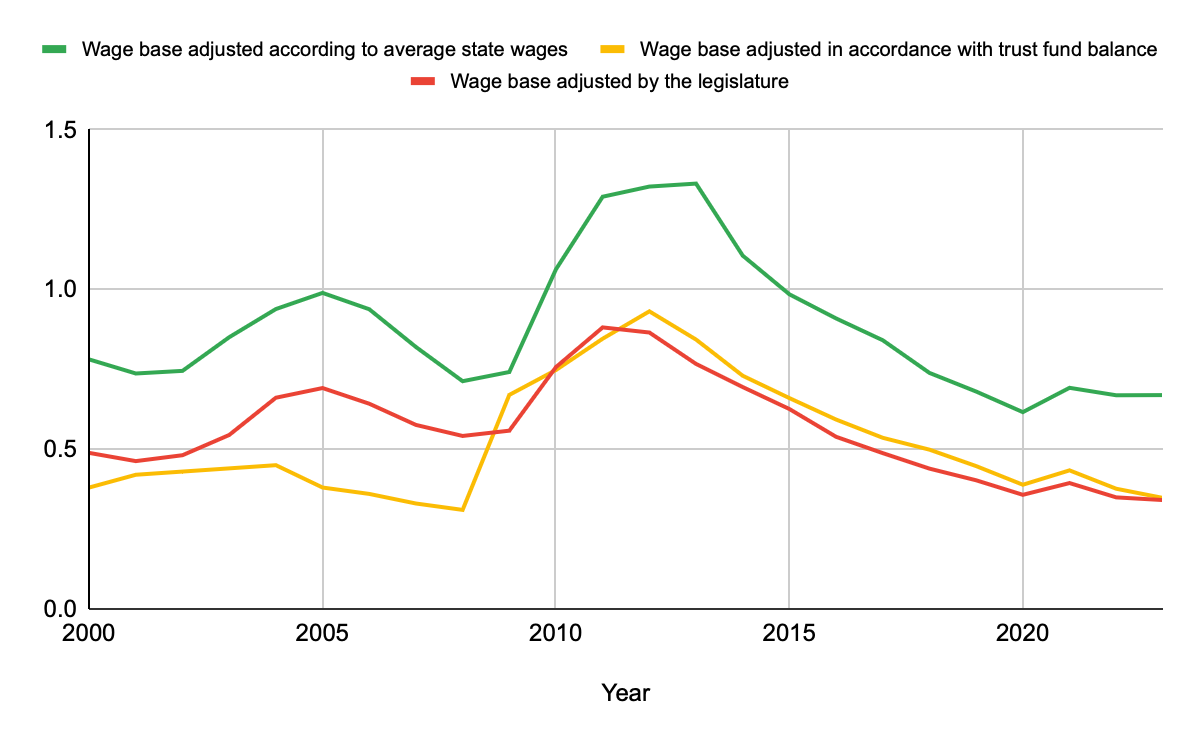
Indexed states maintain higher reserves relative to the size of their economies
The reserve ratio is determined by factoring in each state’s trust fund balance size and unique number of covered workers and wages. A value less than 1.0 means that a state has fewer reserves than total wages in covered employment; a value over 1.0 translates to more reserves than overall wages. The latter is preferable. Indexed states have consistently been stronger than legislature states according to this measure, and have performed better than trigger states since after the Great Recession. As seen in Figure 6, legislative and trigger states have averaged 0.78 and 0.91 reserve ratios over the last decade (2014–2023), less in program reserves than in total wages in covered employment. Indexed states have averaged a reserve ratio of 2.07 over the same period, more than two times higher.
Figure 6: Reserve ratio according to type of state wage base adjustment
Data source: U.S. Department of Labor.
Figure 6 also shows that Louisiana, the lone trigger state between 2000–2009, held higher reserves than the average indexed state during the 2000s. This is no longer the case. Louisiana’s initial reserve ratio of over 3.0 eroded as benefit outlays frequently exceeded program contributions. At the same time, indexed states saw positive reserve ratio growth in the mid-2000s and much more rapid improvements in the 2010s.
The average indexed state now performs better than Louisiana and trigger states overall. Prior to the pandemic, indexed states maintained a higher average reserve ratio than in 2000, while trigger and legislature states found themselves in worse fiscal positions. Furthermore, indexed states have seen their average reserve ratio increase by 1.4 points relative to the lows of 2010; trigger and legislature states only experienced 0.84 and 0.67 point increases.
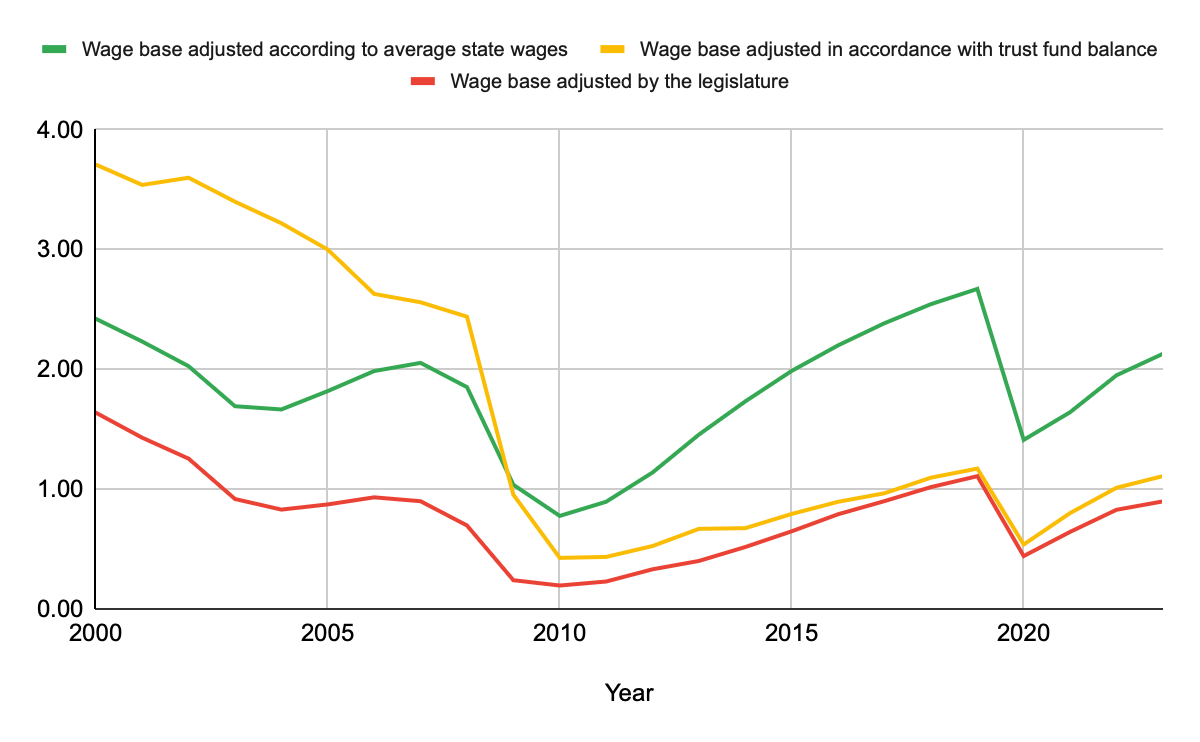
Indexed states maintain more reserves relative to their highest cost year
The high cost multiple (HCM) metric accounts for what the reserve ratio does not: the largest historical benefit costs. In 1995, the Advisory Council on Unemployment Insurance, recommended that state reserves should exceed the previous highest cost rate paid.45 The Department of Labor followed that guidance and now assesses program preparedness by comparing reserves against previous high cost periods.46 This helps determine whether indexed states are better at building up the necessary reserves for economic downturns when benefit claims go up.
Indexed states have been more prepared for their costliest benefit years than trigger and legislature states (Seen in Figure 7). An exception to this trend was Louisiana in the 2000s – the yellow line for trigger states is higher during that period – but its reserves have fallen well short of the state’s highest cost years since then. Despite starting the century at a lower HCM level, indexed states have added to their reserves at greater absolute rates.
Although each category of states experienced its worst HCM level after the Great Recession, only indexed states had recovered ahead of the Covid-19 pandemic and held reserve amounts close to their peak annual cost. Nonindexed states had their best reserve levels relative to their high cost years in 2000. Their HCM ratios dropped as the early 2000s recession progressed, and they never returned to those initial levels. Over the past decade, indexed states have averaged a high cost multiple of 0.72 – meaning trust fund reserves of around three-quarters the level of the highest cost 12-month period – while trigger and legislature states averaged 0.32 and 0.37 rates.
Figure 7: High Cost Multiple value according to type of state wage base adjustment
Data source: U.S. Department of Labor.
States with indexed bases are less reliant on federal loans
Weakened taxable wage bases and reserve levels have left nonindexed states more vulnerable to insolvency and more reliant on federal loans over time compared with indexed states. The extent to which states rely on federal loans depends on a range of factors, including the level of unemployment, the proximity of the most recent recession hit, and whether Congress has provided separate fiscal support during the recession.
In each of the past three recessions, a greater proportion of legislature states than indexed states have required federal loans to cover benefit payments. The story is more complicated for trigger states. Louisiana didn’t take out loans during the recession of the early 2000s or the Great Recession, and other states that adopted trigger rules between 2009–2014 all paid off their Great Recession loans a year before North Carolina (the remaining index state with loan debt in 2014). However, trigger states performed worse, on average, than indexed states in response to the Covid recession. These results are shown in Figure 8, below.
Figure 8: Percentage of states with federal loan debt according to type of state wage base adjustment
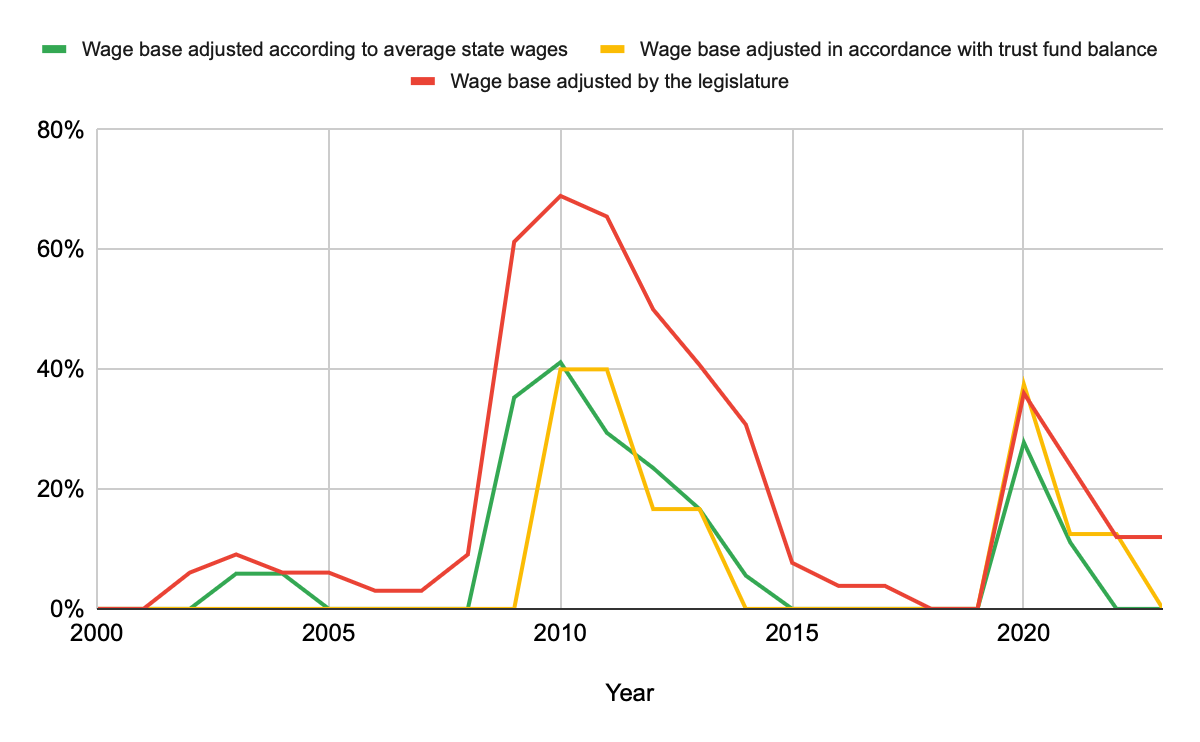
Data source: U.S. Department of Labor.
In the early 2000s, only a slightly higher percentage of legislature states required loans relative to indexed states, yet legislature states started requiring federal support the year before (2002 vs. 2003) and failed to pay off those loans before the Great Recession. At least one legislature state had outstanding loans from 2002 until 2018. Since Louisiana started off with a substantial reserve and was the only trigger state until 2009, no trigger states (yellow) took out loans in the early 2000s.
The disparity between legislature states on one side and indexed and trigger states on the other was largest in the years immediately after the Great Recession. In 2010, 69 percent of legislature states required support, while only 41 percent of indexed states and 40 percent of trigger states did. Those were the highest levels for each category of states. Between 2011 and 2013, the proportion of indexed states and trigger states with loan debt dropped faster than for legislature states. The biggest divide between indexed states and legislature states was 37 percentage points in 2011, and the widest gap between trigger and legislature states was 33 percentage points in 2012. All trigger states had paid off their loans by 2014, a year before all indexed states finished. California, reliant on its legislature to update the state UI wage base, took until 2018 to pay back its loans, longer than any other state.
During the Covid-19 recession, a smaller proportion of indexed states relied on federal loans than trigger and legislature states. Only 28 percent of indexed states needed assistance, while 36 percent of legislature states and 38 percent of trigger states did. Indexed states taking out federal loans also repaid them by the end of 2022, faster than trigger and legislature states. Trigger states collectively took until 2023 to repay their loans. Legislature states still have not fully recovered because California and New York each owe billions of dollars to the federal government.
Barring significant changes to states’ UI laws, there’s reason to believe that indexed states will be less dependent on federal loans than legislature and trigger states in coming years. For one, indexed states have taken out federal loans at a lower rate and paid them back faster than legislature states in each recession this century. Second, indexed state trust funds performed better than trigger states’ in response to the pandemic recession and hold reserves much closer in value to their highest cost year. Third, the average trust fund metrics of trigger states have closely resembled those of legislature states for over a decade. These similarities include the tax rates applied to taxable wages, the erosion of their wage bases, the total percent of wages collected as program contributions, program reserve ratios, and the trust fund reserves relative to states’ highest cost years.
State cases illustrate the importance of a broad, indexed wage base
The track record of specific states provides context as to why nonindexed UI programs are falling into debt. In this section, we contrast the two most insolvent funds of late — California’s and New York’s — with the funds in two indexed states that are paying generous benefits with no outstanding federal debt.
California’s constant struggle
According to the Department of Labor, 1990 was the last year that California’s UI trust fund was flush enough to cover the highest cost period.47 The state’s UI trust fund has gotten progressively more troubled since the turn of the century, as its program rules have failed to keep up with changing times. California has used a taxable wage base of $7,000 since the 1980s, last updated its maximum benefit in 2004, and has applied its highest tax schedule for the past 20 years.48
The fiscal situation has deteriorated in large part because the average benefit payment has grown substantially more than the increase in the program’s tax base. Since 2004, annual revenue has averaged 0.69 percent of total covered wages while the amount of benefit outlays has averaged 0.87 percent, resulting in a deficit.49 As the average state wage has increased, more claimants have qualified for the maximum benefit amount. At the same time, the narrow taxable wage base has failed to capture comparable increases in revenue as wages have gone up. Only 11 percent of total wages were covered by UI taxes in 2023 relative to 19 percent in 2004. This narrow tax base has made it difficult to build up sufficient reserves.50 Despite improved economic conditions in 2023, California paid out more in benefits than it collected in revenue.
California’s situation demonstrates that a program can become insolvent even without legislative measures making benefits more generous. In fact, the governor has actually rejected a program expansion.51 Benefit outlays have been substantial enough the past few years that California’s potential total federal credit reduction for 2025 is 4.9 percent.52 Under those conditions, a California business with 100 employees would need to pay $34,300 more in federal unemployment taxes compared with an identical business in a neighboring state. California businesses will likely incur a lower penalty – waivers should bring the figure to $8,400 more per 100 employees – but the overall shortfall and the potential tax exposure are significantly greater than in any other state right now.
Absent reforms, the state will struggle to cover existing benefit costs and continue to provide less coverage to middle-class workers over time. The average weekly benefit was 31 percent the size of the average weekly wage in California almost a quarter of a century ago. As of 2023, the average benefit only covered 22 percent of the state’s average weekly wage. This downward trend can largely be attributed to a low maximum benefit level, which will be difficult to raise until the trust fund is no longer depleted.
New York’s missed opportunity
New York last had enough reserves to cover its highest cost period in 1974.53 The state’s taxable wage base is currently $12,800, but it would be around $28,500 today if it had been indexed in 1974 for average wage growth. New York has relied on federal loans each recession this century. Only 16 percent of total wages in the state are taxable compared with 19 percent 20 years ago. The national average is 7 percentage points higher. Businesses in the state are likely to pay $8,400 more in federal taxes per 100 employees than states without federal loan debt (the amount could go as high as $16,100 per 100 employees).
However, the situation is somewhat different than in California. New York State lawmakers have passed legislation to address the state’s UI solvency issues. The legislature has increased the UI taxable wage base by about $4,000 since 2014. On average, New York has brought in UI tax contributions equal to 0.61 percent of total covered wages in a given year and paid out benefits equal to 0.69 percent. New York has been able to maintain comparatively better net reserves than California albeit still at an inadequate level.
The major concern is whether New York’s taxable wage base, which is set to become 16 percent of the state average weekly wage after 2026, will be high enough to cover benefit cost increases over time.54 Unlike California, New York increased benefits this year. State lawmakers included provisions in a recent budget agreement to pay back the remaining federal UI debt with emergency funds, as other states have done.55 With the debt eliminated, the maximum benefit level in New York automatically increased from $504/week to $869/week and will remain at 50 percent of the state average weekly wage (assuming program solvency).56 Lifting the maximum benefit level will help middle-income New Yorkers: The higher benefit will cover 47 percent of the average state salary, a substantial increase from the 27 percent insured last year.57 This will allow workers to cover more key expenses while searching for a new job.
However, setting the taxable wage base at a fraction of the maximum possible benefit size could put the state’s UI program in a tough fiscal position in an economic downturn. Neighboring Connecticut found this out the hard way during the pandemic.58 Entering the pandemic, Connecticut’s taxable wage base was higher and its maximum benefit level was lower than what New York’s are set to become, and yet it still became insolvent.59 Connecticut lawmakers responded by raising the taxable wage base to $25,000 in 2024 and indexing it.60 New York legislators could enhance the taxable wage base to help avoid future program insolvency and minimize reliance on emergency bailouts.
Utah’s pragmatic approach
Utah currently has enough reserves to cover its highest historical cost period.61 The state has not held federal debt at the end of any fiscal year this century. An indexed UI taxable wage base allows Utah to provide fairly generous benefits while avoiding the same insolvency issues. Utah indexed its taxable wage base in 1977, which now sits at $48,900.62 As a result, it taxes the same percentage of wages today as it did 20 years ago: 58 percent.
Utah’s fiscal pragmatism should not be confused with austerity. The average replacement was 44 percent in 2004 and 45 percent in 2023, higher than in California and New York. In nominal dollars, the average 2023 benefit size in Utah was over $100 larger than in New York and California.63 When adjusting for recipiency — the share of unemployed workers receiving UI benefits — Utah’s average benefit payment per unemployed worker in 2023 was in line with California and $30 less per week than in New York. Utah could likely bring its net benefit generosity (factoring in benefit sizes and recipiency) modestly higher without taking on debt.
Crucially, Utah’s indexed taxable wage base helps to build sufficient reserves even as overall benefit costs rise. The average annual tax contribution rate in Utah has equaled 0.50 percent of total covered wages in the state, while average annual benefit cost has been at 0.47 percent. The collective size of the taxable wage base ensures that the state collects adequate contributions to offset the cost of benefits over time.
Minnesota’s model of success
Minnesota last had enough trust fund reserves to cover the state’s highest cost period in 2015.64 It indexed its UI taxable wage base in 1983 and currently stands at $43,000.65 A similar proportion of total wages has remained taxable over time. Forty-seven percent of all wages were taxable 20years ago and 49 percent of total wages were taxable for UI purposes in 2023. This coverage has helped Minnesota maintain a stable wage replacement rate of around 40 percent.
Minnesota has managed to provide more generous benefits, in both size and recipiency rate, while also taking on less debt than the two coastal states. California has owed federal loans in 13 of the 20 years between 2004 and 2023. New York held outstanding loans for 12 years. Minnesota owed loans in six of those years and used emergency funds to repay loans taken out during the pandemic rather than raise taxes.66
Although Utah has avoided federal debt altogether, the Minnesota model may be better suited for California and New York.67 The fiscal imprint of Minnesota’s UI program is more in line with where California and New York started two decades ago. Since 2004, Minnesota has brought in average annual tax contributions equalling 0.90 percent of total covered wages and paid out benefits equalling 0.85 percent.
Reforms to improve solvency: Broadening the base and indexation
There are two sets of taxable wage base options for policymakers to consider. One set is at the federal level and the other set is at the state level. Our recommendations are similar in each scenario: States must broaden and index their UI taxable wage base to cover a sufficient proportion of wages.
Congress has established an effective national baseline for states in the past and can do so again. This involves raising the taxable wage base to undo past erosion and adjusting the new amount for inflation or wage growth. The federal options below present a possible FUTA wage base value that is subsequently indexed. Affected states would still retain autonomy over the tax rates that apply to their wage base, meaning that states with solvent programs could reduce the SUTA rates to raise similar amounts as they do now.
Individual states may need to take their own steps to balance program contributions with benefit payments. State taxable wage base reforms beyond the FUTA level can help states avoid program insolvency. Our recommendations can help states struggling with program insolvency, weighing benefit expansions, or simply focused on maintaining their existing benefit provisions.
The importance of indexation
Besides adjusting the state taxable wage base to offset past erosion due to inflation, it is critical that states consider indexation to maintain the real value of their wage bases over time. States often face solvency issues because they fail to adjust their wage bases alongside economic growth. They also have often kept their wage bases fixed while raising benefit levels due to wage growth alone. The combination of a static wage base, failure to take advantage of economic growth, and rising benefit levels results, predictably, in an inadequate revenue stream.
Indexation prevents this dynamic by aligning the wage base level with changes in the economy. States could automatically adjust their wage bases for increases to the cost of living or wages. Both options have a positive impact on solvency, but wage-driven indexation does a better job offsetting benefit costs over time.68 States that currently index have pinned their wage bases to average wage growth in their state, making it the sensible model for other states to consider (See Table 2, below).
Even solvent states uninterested in a major UI benefit expansion should consider indexation. While they may be unlikely to implement more generous benefits and program contributions, lawmakers in those states could opt to conserve existing wage bases and benefit levels via indexation. Programs with a small fiscal impact would remain modest without any erosion due to inflation or wage increases over time.
Federal-level options for broadening the base
At a minimum, Congress should update the FUTA wage base to account for the recent surge of inflation during the Covid-19 pandemic recovery. Bringing the FUTA wage base up to $8,000 from its current $7,000 and indexing it would primarily serve to undo the erosion due to inflation from the start of 2022, and restore the wage base value to where it’s been for most of this century. This adjustment would be sufficient to pay for key reforms to how unemployment agencies are financed at the federal level.69
A more ambitious option would be for Congress to return the FUTA wage base value to its 1983 standard, when the wage base was last updated. If the FUTA wage base had been adjusted for inflation from that year onward, it would be valued at $22,960 today. Congress could have helped states avoid trust fund depletions in recent recessions if the FUTA wage base had been set at this level.
State-level option for wage base reform
States that have indexed their UI wage bases typically set the base to a certain percentage of the average state wage. As shown in Table 2, the percentage has ranged from 46.5 percent to 100 percent. This approach can ensure that a stable proportion of wages in a state are taxed over time. A good rule of thumb could be that the wage base should match the wages receiving benefit coverage, strengthening the contributory nature of the program. If a state UI program sets the maximum benefit equal to 50 percent of the state average weekly wage, then the taxable wage base should cover the same annualized amount.
Table 2: How indexed states adjust their wage base according to the average state wage, 2023
| State | % of the state average annual wage |
| Alaska | 75% |
| Hawaii | 100% |
| Idaho | 100% |
| Iowa | 66.6%* |
| Minnesota | 60% |
| Montana | 80% |
| Nevada | 66.6% |
| New Jersey | 54% |
| New Mexico | 60% |
| North Carolina | 50% |
| North Dakota | 70% |
| Oklahoma | Ranges between 40% and 50% |
| Oregon | 80% |
| Rhode Island | 46.5% |
| Utah | 75% |
| Washington | Not to exceed 80% (The wage base is set at 115% of the prior year’s level.) |
| Wyoming | 55% |
Source: Department of Labor, Comparison of State Unemployment Laws 2023.
*Although Iowa’s wage base is listed as 66.6% of the average annual wage in 2023, recent legislation has brought the figure down to 33.3%.
Note: Vermont is not included in this table, because the state’s wage base adjustment is not true indexation. When Vermont’s trust fund is positive, the wage base increases proportionally with increases to the state average annual wage. Colorado, Connecticut, Kansas, and New York are not reflected in the table due to their more recent indexation laws, but all are set to adjust their wage bases according to wage growth over time.
Although indexing for wage growth can support benefit expansions, there are other useful applications. Fiscally conservative states can broaden and index their taxable wage bases to better maintain existing benefit provisions. Average benefit levels and program costs can rise as the state economy grows, even in the absence of new reforms. States can minimize the risk of program shortfalls by properly adjusting their wage bases for wage growth experienced within state borders.
Conclusion
The size and responsiveness of a state’s taxable wage base play a decisive role in the solvency and stability of its unemployment insurance (UI) trust fund. Indexed states, which automatically adjust their wage bases alongside wage growth, have largely outperformed legislature and trigger states across key trust fund indicators over the past 15 years. Nonindexed states have raised less revenue relative to the size of their economies and have been more likely to enter economic downturns with fewer reserves.
Although the sole trigger state in the early 2000s – Louisiana – did not take out federal loans during that initial period, the performance of trigger states has gotten progressively worse as more states have adopted this approach. Trigger states were slightly less reliant on federal loans during the Great Recession than indexed states, but their trust funds never recovered and were worse off during the pandemic. This deterioration may have been inevitable given that the overall tax contribution rates of trigger states have resembled legislature states’ contribution rates since 2000.
We have proposed federal and state reforms to help minimize program reliance on loans. The federal-level suggestions focus on setting a proper baseline taxable wage base for the country. The state-level recommendations are primarily targeted at states already struggling with or at risk of insolvency. Despite underwhelming benefit levels, state programs such as California’s and New York’s have repeatedly gone into debt. Insolvent programs then force businesses to shoulder sudden tax spikes amid an economic recovery. Meanwhile, workers, especially those that are middle-income, suffer from lower benefit levels. State programs often insure under 25 percent of prior wages, making it difficult to cover the rising costs of key expenses like housing, food, utilities, transportation, and healthcare.
By tying the taxable wage base to a consistent share of the average state wage and allowing it to rise with earnings over time, states can better balance revenue with benefit costs. Indexation helps support a sustainable path that preserves the integrity of the UI safety net for workers and the long-term fiscal health of states.
Appendix A: Year states enacted their trigger laws
| State | Year that trigger law went into full effect |
| Louisiana | 199570 |
| Tennessee | 200971 |
| West Virginia | 200972 |
| Illinois | 201073 |
| Missouri | 201074 |
| Michigan | 201275 |
| Delaware | 201476 |
| Arkansas | 202077 |
Appendix B: Insolvency and the federal government’s role
We describe the federal loan system here. By statute, the federal government sets the terms when trust funds are depleted. Stringent loan regulations are in place to ensure that states repay their debt in a timely manner.
Development of the federal loan system
Congress recognized early on that state programs may require federal assistance during recessions. A federal UI loan fund, known as the George Loan Fund for Senator Walter F. George, a Georgia Democrat and Senate Finance Committee chair at the time, was established at the end of World War II “in anticipation of heavy unemployment during the reconversion period.”78 States could access interest-free loans when their trust fund balances fell short of recent fiscal year benefit costs. Yet, no states required loans during this period and the original loan fund was allowed to expire.
Over the next decade, calls to renew use of federal loans won out over efforts by the Truman administration to supply reinsurance grants to state programs in crisis due to unavoidable unemployment. Congress enacted the legislation in 1954 to establish a new federal loan fund. Businesses would see tax credit reductions in states with outstanding loans beginning in the fourth year after the assistance was provided.
It soon became clear that stronger incentives were needed to ensure that states repaid their loans. In 1960, Congress enacted legislation that ensured credit reductions would start taking effect if loans were not repaid by the second January after the sum was taken out. By the third year after a state received a loan, additional credit reductions were possible if the indebted state failed “to collect taxes equal to at least 2.7 percent of its employers’ taxable payrolls.”79
Congress enacted another significant repayment reform in the early 1980s: allowing loans to accrue interest.80 High unemployment in the mid 1970s forced a number of states to lean on federal loans, and years later some still had not repaid their debts.81 The federal government was taking real losses on these loans, and fiscally responsible states were frustrated with those that had not made the appropriate payments.82 In response, Congress decided that states with outstanding debt would need to make interest payments on loans that were not paid off within a year.83
The current federal loan system
The federal loan system and the incentives added to ensure repayment – the credit reductions and interest charges – still exist. When a shortfall occurs, states generally must borrow funds from the federal UI loan account known as the Federal Unemployment Account (FUA). States then have anywhere from 22 months to 34 months to pay back the loans before penalties are assessed, depending on what point in the calendar year the borrowing occurred.84
Loans start accruing interest at the end of the fiscal year when the funds were first borrowed. Depending on when loans are taken out, states may have the ability to delay loan interest accrued in one fiscal year until the end of the next year.85 The interest payments must be made with general revenues or funding other than traditional state unemployment taxes.86 If a state does not make prompt interest payments, it will not receive federal administrative grants to manage its UI program nor will businesses in the state receive any Federal Unemployment Tax Act (FUTA) credit. Even if loans are not returned immediately, the federal government expects to be paid the interest.
If a state has not repaid its loans by the initial deadline, businesses in the state will see their effective federal unemployment tax rate increase. When loans have not been repaid by the second year, there is a 0.3 percentage point reduction to the FUTA credit that normally offsets 5.4 percentage points of the 6 percent FUTA tax rate. Subsequent 0.3 percentage point reductions may occur for each additional year a loan remains unpaid, and further credit reductions may be assessed when the average state tax rate applied to total wages is inadequate.87
The longer that states take to repay UI loans, the bigger their federal tax credit reduction can get. In addition to the annual 0.3 percentage point reduction, there are additional federal tax penalties that can be applied when states hold program debt for longer than two years. In years three and four of unpaid obligations, there may be a 2.7 add-on.88 The add-on is calculated with this formula, according to the Congressional Research Service:89
[(2.7% × 7000 ÷ U.S. Annual Average Wage) – Average Annual State Tax Rate on Total Wages] × State Annual Average Wage ÷ 7000.
To trigger this credit reduction, the average annual state tax rate on total wages must approximately be below 0.3 percent this year. The typical nonindexed state is above that threshold, including California. In the past, states have been more likely to meet the criteria for a separate credit reduction add-on that can be applied after year four.90
Beginning in year five, a benefit cost ratio (BCR) add-on can take effect.91 This credit reduction is equal to “the 5-year benefit cost rate applicable to such State for such taxable year” (i.e., one-fifth of the benefits paid over the five-year period ending two years ago divided by taxable wages in covered employment last year) or 2.7 percent, whichever is higher, minus the average tax rate on total wages in the state for “the calendar year preceding such taxable year.” California’s benefit outlays have been substantial enough the past few years that its potential total credit reduction for 2025 was 4.9 percent, with 3.7 percentage points coming from the BCR add-on (recall: the total possible FUTA credit is 5.4 percent).92
Notably, states including California have the opportunity to prevent credit reductions such as the BCR add-on. This can be done three different ways: 1) specifically waiving the BCR add-on; 2) “avoiding” the credit reduction; and 3) “limiting” the credit reduction.
BCR Waiver
States can apply to waive the BCR add-on and have it replaced by the less severe 2.7 add-on if no actions have been taken – legislative or otherwise – that have decreased the program’s net solvency.93 The BCR waiver is why states with outstanding federal loans are frequently able to prevent add-on credit reductions and exclusively face the incremental 0.3 percentage point reductions.94 States us95ually apply for this waiver, although Connecticut opted to face BCR add-on reductions in 2014 and 2015.
Credit Avoidance
In order to avoid a credit reduction for a given year, a state must:96
- at minimum, repay any advances taken out in the preceding one-year period and the cost of the potential credit reduction
- maintain a program trust fund capable of covering benefit costs at present
- improve net program solvency through legislative action
If a state manages to qualify, “that year and January 1 of that year to which the avoidance applies will be taken into account for purposes of determining reduction of tax credits for subsequent taxable years.” The year still counts towards the total years under consideration for credit reductions, but the state has the opportunity to shift the financial burden from being directly on businesses.
Credit Limiting
Once a state begins to face credit reductions, it can also apply to limit the total reduction it faces to the greater of 0.6 percent or the rate faced in the preceding year.97 To qualify, a state must have:
- not taken any actions to hurt tax revenue or program solvency over the prior year
- brought in more revenue than average benefit costs over the last five years
- a smaller loan balance relative to three years prior
Unlike with credit avoidance, when a state meets the necessary criteria in this case, “the taxable year for which the credit reduction was so limited (and January 1 thereof) shall not be taken into account” in subsequent years.98 States have generally not used credit limiting, opting to pay off the loans faster.
- Will Raderman, The need for balanced unemployment benefit expansions (Washington, D.C.: Niskanen Center, 2025). ↩︎
- Employment and Training Administration, Notice of the Federal Unemployment Tax Act (FUTA) Credit Reductions Applicable for 2024 (Washington, D.C.: U.S. Department of Labor, 2024). ↩︎
- Employment and Training Administration, Financial Data HANDBOOK 394 Report (Washington, D.C.: U.S. Department of Labor, 2024). ↩︎
- Employment and Training Administration, FUTA Credit Reductions (Washington, D.C.: U.S. Department of Labor, 2025). ↩︎
- Gabriel Petek, Fixing Unemployment Insurance (Sacramento, CA: Legislative Analyst’s Office, December 2024). ↩︎
- January 2025); Mark Duggan, Jonathan Gruber, and Audrey Guo, The Revenue and Distributional Impacts of Unemployment Insurance Reform: Evidence from California (Cambridge, MA: National Bureau of Economic Research, July 2025). ↩︎
- Wayne Vroman, The Funding Crisis in State Unemployment Insurance (Kalamazoo, MI: W.E. Upjohn Institute for Employment Research, 1986); Winston-Salem Journal, More cuts coming to NC unemployment benefits (Raleigh, NC: Fox8 News, 2014); Ian Greer, New York must get serious about fixing Unemployment Insurance (Albany, NY: Times Union, April 2025); Gordon Dahl and Matthew M. Knepper, Unemployment Insurance, Starting Salaries, and Jobs (Cambridge, MA: National Bureau of Economic Research, June 2022). ↩︎
- William Haber and Merrill G. Murray, Unemployment Insurance in the American Economy: An Historical Review and Analysis (Homewood, IL: Richard D. Irwin Inc., 1966). ↩︎
- Alexander Hertel-Fernandez, “Dismantling Policy through Fiscal Constriction: Examining the Erosion in State Unemployment Insurance Finances,” Social Service Review Vol. 87, No. 3 (September 2013). ↩︎
- Office of Unemployment Insurance Division of Fiscal and Actuarial Services, State Unemployment Insurance Tax Measures Report 2019 (Washington, D.C.: U.S. Department of Labor, March 2020); Office of Unemployment Insurance Division of Fiscal and Actuarial Services, State Unemployment Insurance Tax Measures Report 2023 (Washington, D.C.: U.S. Department of Labor, April 2024). ↩︎
- Will Raderman, The need for balanced unemployment benefit expansions. ↩︎
- Robbie Brown, North Carolina Approves Steep Benefit Cuts for Jobless in Bid to Reduce Debt (New York, NY: New York Times, February 2013). ↩︎
- U.S. Government Accountability Office, Unemployment Insurance: States’ Reductions in Maximum Benefit Durations Have Implications for Federal Costs (Washington, D.C.: GAO, 2015). ↩︎
- Center on Budget and Policy Priorities, Policy Basics: How Many Weeks of Unemployment Compensation Are Available? (Washington, D.C.: CBPP, October 2025). ↩︎
- Employment and Training Administration, Significant Provisions of State Unemployment Insurance Laws Effective January 2025 (Washington, D.C.: U.S. Department of Labor, 2025). ↩︎
- Alexander Hertel-Fernandez, “Dismantling Policy through Fiscal Constriction: Examining the Erosion in State Unemployment Insurance Finances.” ↩︎
- U.S. Government Accountability Office, Unemployment Insurance Trust Funds: Long-standing State Financing Policies Have Increased Risk of Insolvency (Washington, D.C.: GAO, May 2010). ↩︎
- Alexander Hertel-Fernandez, “Dismantling Policy through Fiscal Constriction: Examining the Erosion in State Unemployment Insurance Finances.” ↩︎
- Employment and Training Administration, Comparison of State Unemployment Laws 2023: Financing. ↩︎
- Matt Darling, Creating a More Dynamic Unemployment Insurance System: The Case for Eliminating Experience Rating (Washington, D.C.: Niskanen Center, April 2024); Julie M. Whittaker, Unemployment Compensation: The Fundamentals of the Federal Unemployment Tax (FUTA). ↩︎
- ETA Division of Fiscal and Actuarial Services, Introduction to Unemployment Insurance Financing (Washington, D.C.: U.S. Department of Labor, October 2018). ↩︎
- Notably, trust funds in reserve ratio states have taken longer to recover from shocks than benefit ratio states. See: Marta Lachowska, Wayne Vroman, and Stephen A. Woodbury, “Experience Rating and the Dynamics of Financing Unemployment Insurance,” National Tax Journal Vol. 73 No. 3 (September 2020). ↩︎
- Office of Unemployment Insurance Division of Fiscal and Actuarial Services, State Unemployment Insurance Tax Measures Report 2024 (Washington, D.C.: U.S. Department of Labor, March 2025). ↩︎
- Office of Unemployment Insurance Division of Fiscal and Actuarial Services, State Unemployment Insurance Tax Measures Report 2015 (Washington, D.C.: U.S. Department of Labor, May 2016). ↩︎
- Matt Darling, Fix unemployment insurance to help young men into work (Washington, D.C.: American Institute for Boys and Men, May 2024). ↩︎
- Marta Lachowska, Isaac Sorkin, and Stephen A. Woodbury, Employers and Unemployment Insurance Take-Up (Cambridge, MA.: National Bureau of Economic Research, February 2023). ↩︎
- Andrew C. Johnston, “Unemployment Insurance Taxes and Labor Demand: Quasi-Experimental Evidence from Administrative Data,” American Economic Journal: Economic Policy Vol. 13, No. 1 (February 2021). ↩︎
- Matt Darling, Creating a More Dynamic Unemployment Insurance System: The Case for Eliminating Experience Rating; Will Raderman, The need for balanced unemployment benefit expansions. ↩︎
- Employment and Training Administration, Comparison of State Unemployment Laws 2023: Financing. ↩︎
- Gabriel Petek, Fixing Unemployment Insurance. ↩︎
- Mark Duggan, Jonathan Gruber, and Audrey Guo, The Revenue and Distributional Impacts of Unemployment Insurance Reform: Evidence from California. ↩︎
- Julie M. Whittaker, Unemployment Compensation: The Fundamentals of the Federal Unemployment Tax (FUTA) (Washington, D.C.: Congressional Research Service, October 2016). ↩︎
- Most states apply a uniform wage base across all employers, but several different wage bases can be applied as Nebraska has done. See: Nebraska Department of Labor, A guide to understanding Nebraska’s Unemployment Insurance Combined Tax Rates (2023). ↩︎
- Employment and Training Administration, Comparison of State Unemployment Laws 2023: Financing (Washington, D.C.: U.S. Department of Labor, 2025). ↩︎
- Employment and Training Administration, Comparison of State Unemployment Laws 2023: Financing. ↩︎
- William Haber and Merrill G. Murray, Unemployment Insurance in the American Economy: An Historical Review and Analysis. ↩︎
- Daniel N. Price, Unemployment Insurance, Then and Now, 1935–85 (Washington, D.C.: Social Security Bulletin, October 1985). ↩︎
- Wayne Vroman, Elaine Maag, Christopher O’Leary, and Stephen A. Woodbury, A Comparative Analysis of Unemployment Insurance Financing Methods (Washington, D.C.: The Urban Institute, December 2017). ↩︎
- Social Security Administration, Contribution and Benefit Base (Washington, D.C.: 2025). ↩︎
- Social Security Administration, Contribution and Benefit Base. ↩︎
- Wayne Vroman, The Funding Crisis in State Unemployment Insurance. ↩︎
- Vermont General Assembly, 21 V.S.A. § 1321 (Montpelier, VT: State of Vermont, 2025). ↩︎
- Connecticut Department of Labor, Information on Unemployment Tax Rate for Calendar Year 2024 (Wethersfield, CT: CT DOL, 2024); Ernst & Young, 2025 state unemployment insurance taxable wage bases; Colorado General Assembly, SB20-207 (Denver, CO: 2020); NY Department of Taxation and Finance, 2024 Form NYS-50, Employer’s Guide to Unemployment Insurance, Wage Reporting, and Withholding Tax (Albany, NY: NY Department of Labor, 2024). ↩︎
- Employment and Training Administration, Comparison of State Unemployment Laws 2023: Financing. ↩︎
- The recommendation specified an average of the three highest annual levels. Using the single highest annual rate, as done in this report, sets a higher fiscal benchmark. See: U.S. Advisory Council on Unemployment Compensation, Unemployment Insurance in the United States, Benefits, Financing, and Coverage: A Report to the President and Congress (Washington, D.C.: Advisory Council on Unemployment Compensation, 1995). ↩︎
- Note: the denominator for the high cost multiple (HCM) metric is not static. The highest cost benefit year is expressed as total benefits paid out divided by the total amount of covered wages that year. As the unemployment rate rises and benefit costs (top of fraction) go up, the total wages paid in covered employment (bottom of fraction) are affected as well. See: Office of Unemployment Insurance Division of Fiscal and Actuarial Services, State Unemployment Insurance Tax Measures Report 2024. ↩︎
- The highest cost period is a state’s highest 3-year average benefit cost rate, which adjusts for total state wages during those years. See: Office of Unemployment Insurance Division of Fiscal and Actuarial Services, State Unemployment Insurance Trust Fund Solvency Report 2025 (Washington, D.C.: U.S. Department of Labor, February 2025). ↩︎
- Thomas Rankin, California’s unemployment insurance system is so poorly funded it pays 2004 wages (Sacramento, CA: CalMatters, November 2023). ↩︎
- Employment and Training Administration, Financial Data HANDBOOK 394 Report. ↩︎
- Mark Duggan, Jonathan Gruber, and Audrey Guo, The Revenue and Distributional Impacts of Unemployment Insurance Reform: Evidence from California. ↩︎
- Will Raderman, California has a $20 billion problem and no clear way to solve it (San Francisco, CA: San Francisco Chronicle, November 2023). ↩︎
- Employment and Training Administration, Potential 2025 FUTA Credit Reductions (Washington, D.C.: U.S. Department of Labor, 2025). ↩︎
- Office of Unemployment Insurance Division of Fiscal and Actuarial Services, State Unemployment Insurance Trust Fund Solvency Report 2025. ↩︎
- NYS Department of Labor, NYS-45 Quarterly Reporting (Albany, NY: NYS DOL, 2025). ↩︎
- Julia Rock, New York Will Boost Unemployment Benefits, Labor and Businesses Celebrate (New York, NY: New York Focus, May 2025). ↩︎
- NYS AFL-CIO, Legislative Alert: May 9, 2025 (Albany, NY: NYS AFL-CIO, May 2025). ↩︎
- NYS Department of Labor, New York State Average Weekly Wage (NYSAWW) (Albany, NY: NYS DOL, 2025). ↩︎
- Adam Nicholson, Connecticut lawmakers take steps to protect worker benefits. Its New England neighbors should do the same (Washington, D.C.: Niskanen Center, March 2025). ↩︎
- Employment and Training Administration, Significant Provisions of State Unemployment Insurance Laws Effective January 2020 (Washington, D.C.: U.S. Department of Labor, 2020); NYS Department of Labor, New York State Average Weekly Wage (NYSAWW). ↩︎
- Adam Nicholson, Connecticut lawmakers take steps to protect worker benefits. Its New England neighbors should do the same. ↩︎
- Office of Unemployment Insurance Division of Fiscal and Actuarial Services, State Unemployment Insurance Trust Fund Solvency Report 2025. ↩︎
- Employment and Training Administration, Significant Provisions of State Unemployment Insurance Laws Effective January 2025. ↩︎
- Employment and Training Administration, Financial Data HANDBOOK 394 Report. ↩︎
- Office of Unemployment Insurance Division of Fiscal and Actuarial Services, State Unemployment Insurance Trust Fund Solvency Report 2025. ↩︎
- Employment and Training Administration, Significant Provisions of State Unemployment Insurance Laws Effective January 2025. ↩︎
- Center on Budget and Policy Priorities, Fiscal Recovery Fund Spending by States, U.S. Territories (Washington, D.C.: CBPP, 2025). ↩︎
- Will Raderman and Joshua McCabe, The Minnesota Model for Getting Unemployment Insurance Right (Washington, D.C.: Governing, November 2024). ↩︎
- The Budget Lab, Budgetary Effects of Federal Unemployment Tax Act Reform (New Haven, CT: The Budget Lab at Yale, November 20, 2025). ↩︎
- Will Raderman, Broaden the base, lower the (improper payment) rates (Washington, D.C.: Niskanen Center, November 20, 2025). ↩︎
- Diana Runner, Changes in State unemployment insurance legislation in 1995 (Washington, D.C.: Bureau of Labor Statistics, February 1996). ↩︎
- Tennessee Legislature, TN Code § 50-7-213 (Nashville, TN: 2024). ↩︎
- 87th West Virginia Legislature, Senate Bill No. 246 (Charleston, WV: WV Legislature, March 2009). ↩︎
- Illinois Legislature, Illinois Statutes Chapter 820 Employment § 405/1400.1 Solvency Adjustments (Springfield, IL: IL General Assembly); Illinois Legislature, Public Act 097-0001 (Springfield, IL: IL General Assembly, 2012). ↩︎
- Missouri Legislature, Title XVIII Chapter 288.036. Wages defined — state taxable wage base (Jefferson City, MO: Missouri Legislature, 2015). ↩︎
- Michigan Legislature, Section 421.44 “Remuneration” and “wages” defined (Lansing, MI: Michigan Legislature, 2015). ↩︎
- Delaware Legislature, House Bill 168 (Wilmington, DE: Delaware General Assembly, 2013). ↩︎
- Arkansas Legislature, AR Code § 11-10-215 (Little Rock, AR: Arkansas Legislature, 2024). ↩︎
- William Haber and Merrill G. Murray, Unemployment Insurance in the American Economy: An Historical Review and Analysis. ↩︎
- William Haber and Merrill G. Murray, Unemployment Insurance in the American Economy: An Historical Review and Analysis. ↩︎
- Daniel N. Price, 1981 and 1982 Changes in the Unemployment Insurance Program (Washington, D.C.: Social Security Bulletin, May 1983). ↩︎
- Wayne Vroman, The Funding Crisis in State Unemployment Insurance. ↩︎
- U.S. Senate Finance Committee, Hearing on the Repayment of Loans Made To State Unemployment Insurance Programs (Washington, D.C.: U.S. Senate Finance Committee of the 96th Congress, April 1980). ↩︎
- Congressional Budget Office, Special Study: Federal Debt and Interest Costs (Washington, D.C.: CBO, September 1984). ↩︎
- When an outstanding loan has been held on January 1st for two consecutive years, repayment must occur by November 10th of the latter year. If a loan is taken out on January 1st, 2025, it must be repaid by November 10, 2026. If a loan is taken out on January 2, 2025, repayment must occur by November 10, 2027. See: Julie M. Whittaker, The Unemployment Trust Fund (UTF): State Insolvency and Federal Loans to States (Washington, D.C.: Congressional Research Service, 2023). ↩︎
- 20 CFR §606.40 ↩︎
- Julie M. Whittaker, CRS Reviews Funding of Unemployment Trust Fund (Washington, D.C.: TaxNotes, 2010). ↩︎
- Ernst & Young, A FUTA credit reduction to apply in three jurisdictions in 2024 (Washington, D.C.: EY, 2024). ↩︎
- Portia Wu, Training and Employment Notice No. 35-13: Statutory Provisions for Relief from Interest Charges and Federal Unemployment Tax Act (FUTA) Credit Reductions Resulting from Title XII Advances (Washington, D.C.: U.S. Department of Labor, 2014). ↩︎
- Julie M. Whittaker, The Unemployment Trust Fund (UTF): State Insolvency and Federal Loans to States; 26 U.S. Code § 3302. ↩︎
- ADP, Final 2014 FUTA “Credit Reductions” Released (Roseland, NJ: ADP, November 2014). ↩︎
- 26 U.S. Code § 3302. ↩︎
- Employment and Training Administration, Potential 2025 FUTA Credit Reductions (Washington, D.C.: U.S. Department of Labor, 2025). ↩︎
- Julie M. Whittaker, The Unemployment Trust Fund (UTF): State Insolvency and Federal Loans to States. ↩︎
- Employment and Training Administration, Actual FUTA Credit Reductions 2010-2024 (Washington, D.C.: U.S. Department of Labor, November 2024). ↩︎
- ADP, Final 2014 FUTA “Credit Reductions” Released; ADP, Final 2015 FUTA Credit Reductions Released (Roseland, NJ: ADP, November 2015). ↩︎
- 20 CFR § 606.23 – Avoidance of tax credit reduction. ↩︎
- 26 U.S. Code § 3302 – Credits against tax. ↩︎
- 26 U.S. Code § 3302 – Credits against tax. ↩︎