Energy policy debates often sound like a choice among competing visions of which type of energy would best power America’s future: “dispatchable,” on-demand power produced from fossil fuels and nuclear energy, or quick-build, cheap energy from renewables such as wind and solar?
If only our choice was that simplistic. The reality, however, is that between now and 2030, surging demand for energy will collide with longstanding bottlenecks on new capacity. This mismatch between supply and demand stands to limit how much energy the grid can deliver to build homes, create jobs, support national security, drive the economy — everything we count on energy to do. Meanwhile, competitors such as China are able to rapidly bring new capacity online for data centers and other economic and security imperatives.
The math is unforgiving: Neither dispatchables nor renewables will come close to meeting our needs on their own. We’ll need them all. We already do need them all. A look at the data behind electricity supply and demand shows just how clear-eyed and nimble we’ll need to be to achieve “grid dominance” — that is, ensuring that our power grid is equipped to meet our constantly expanding needs.
Destination: Grid dominance
Abundant electricity hinges on two elements: energy and power. The terms are often used interchangeably, but they represent different things. It’s important to understand the difference in order to understand what energy grid dominance entails.
“Power” refers to the electricity that we use from moment to moment — to turn on the lights, ramp up the factory floor, bring military-base control systems online, and so on.
“Energy,” on the other hand, is what keeps the power going for the period of time that it’s needed — to keep the lights on, the factory output humming, the military base running.
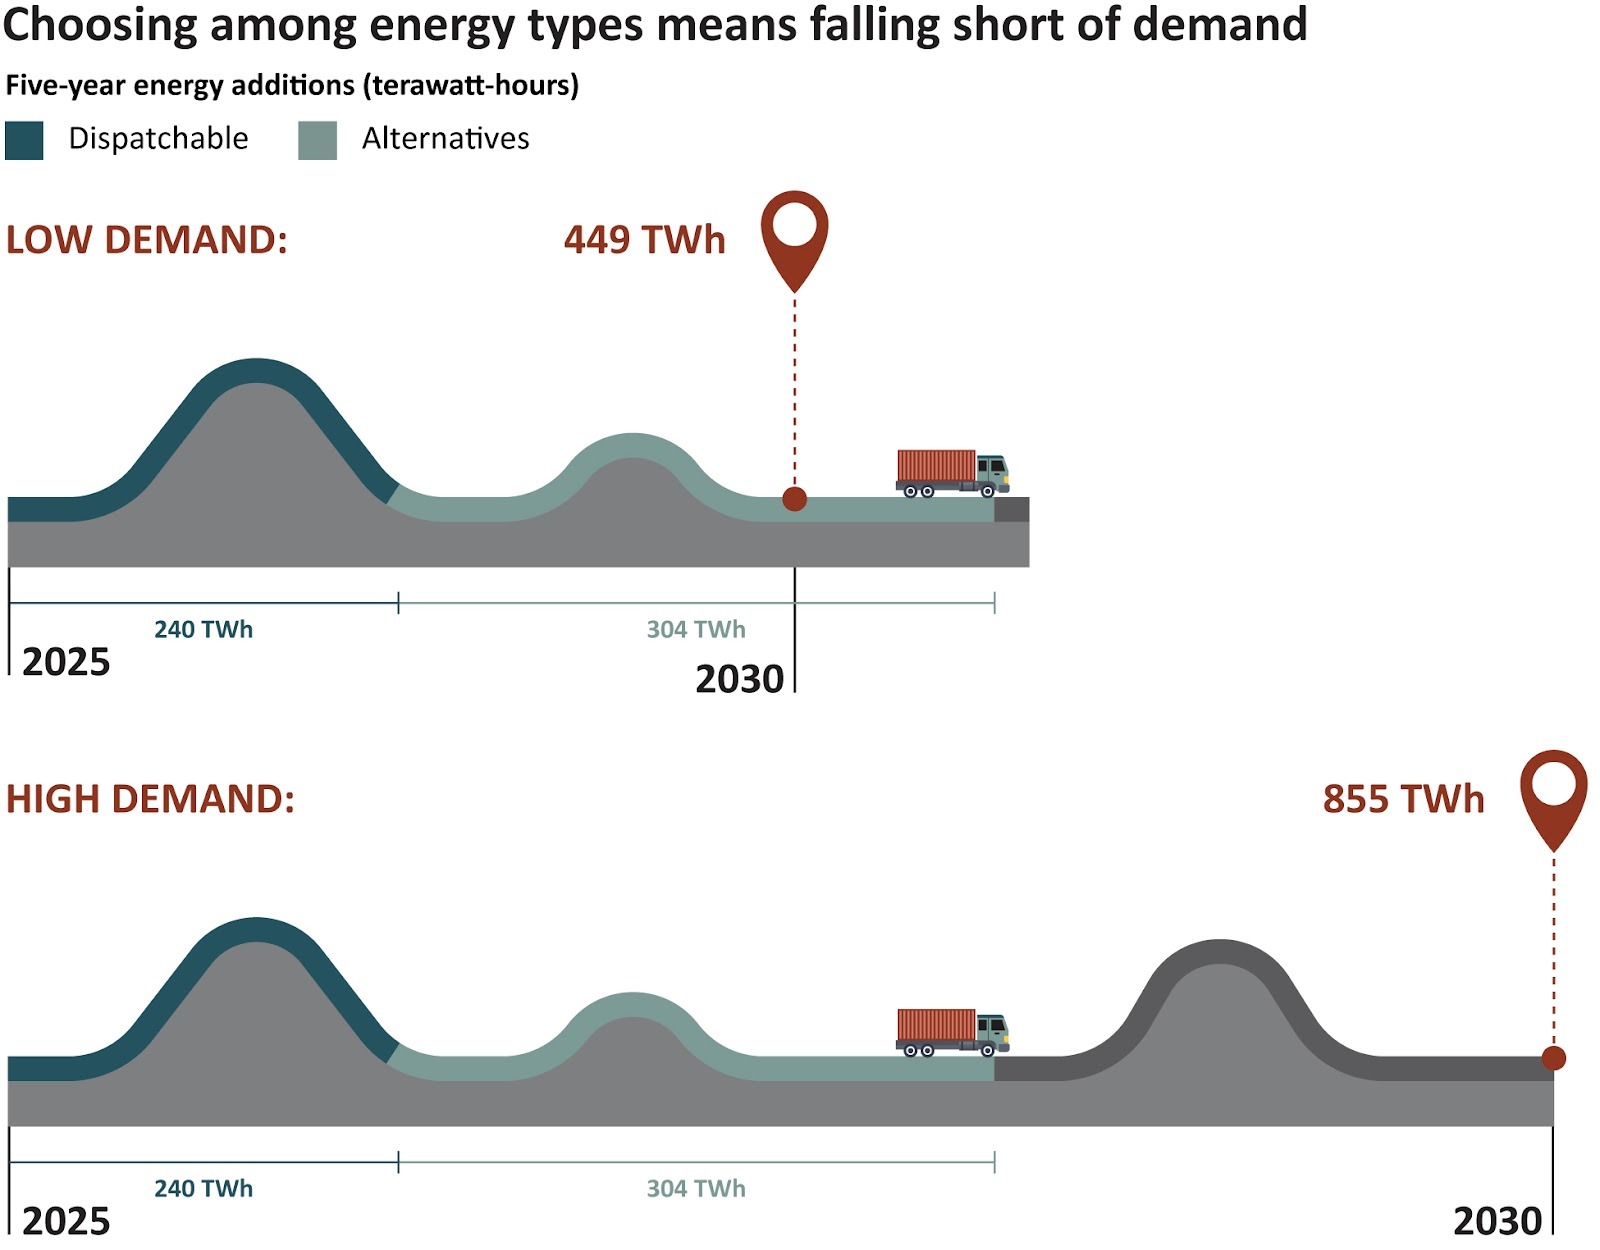
One way to think of it is to visualize a delivery truck hauling goods from a factory to a warehouse 100 miles away, along a route with rises and dips, some high hills and steep grades, and long, flat stretches of roadway, as in the illustration:
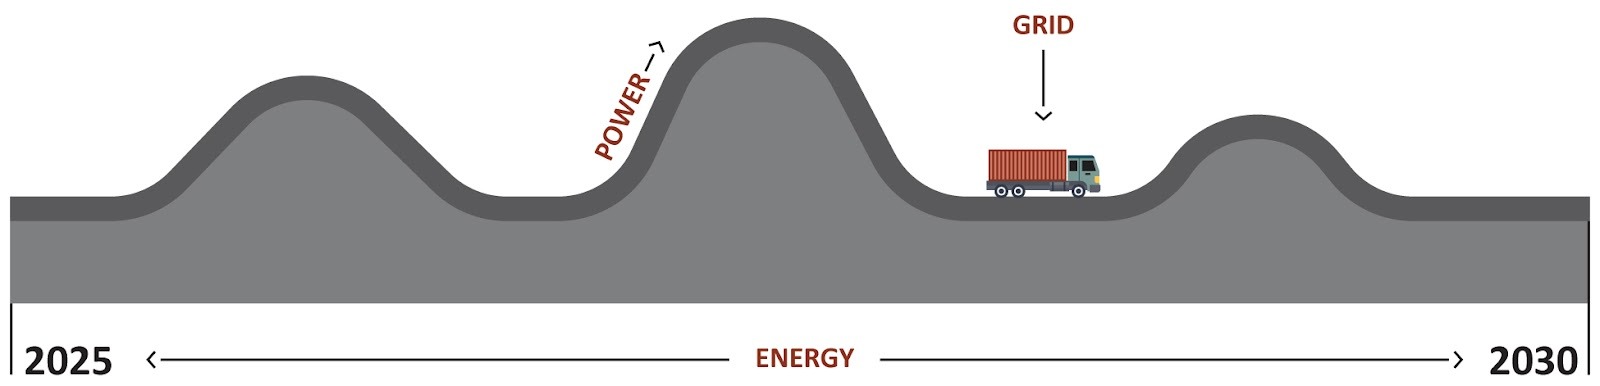
The truck will need a strong motor — the power — to make it up the hills and grades, and enough fuel — energy — to make the 100-mile trip from factory to warehouse and back. The delivery truck represents the power grid, fueled by the power plants connected today and those in development to be connected within the next five years.
“The grid,” it should be noted, is not a single entity, but a nationwide network of power plants, substations, power lines, and other components that convert raw energy into electricity, and then transmit it to homes, businesses, and other end users.
As for the rest of the illustration:
- the road is the demand curve over the next five years
- the hills are estimates of peak demand
- the distance is the total energy needed to reach the destination
And the destination is grid dominance by 2030: an electrical grid that can keep up with a growing economy, including the escalating demand for power from data centers and industrial loads.
Delivering grid dominance requires delivering both power and energy, and we’re right on track … to fall short on both: The truck can’t get up the highest hill, and it won’t make it to the warehouse.
Part 1: Power up the peaks
On July 29, 2025, America’s electrical grid delivered 760 gigawatts of power throughout the lower 48 states. It was a record for peak demand, or the maximum amount of power needed at once to keep the lights on. And yet, experts project that over the next five years, we’ll keep setting records for peak demand.
How much bigger will the peaks be in 2030? Because demand is expanding every year, the delivery truck needs to climb higher hills every year. Here we focus on the additional power that we’ll need on top of the 760 GW the grid is already providing. From 2025 to 2030, peak needs may grow by as little as 103 GW or as much as 197 GW. But we estimate that only about 118 GW of extra power plant capacity will be connected to the grid and available at peak moments over this period, based on power facilities that are already far enough along the intensive and overly time-consuming permitting process.
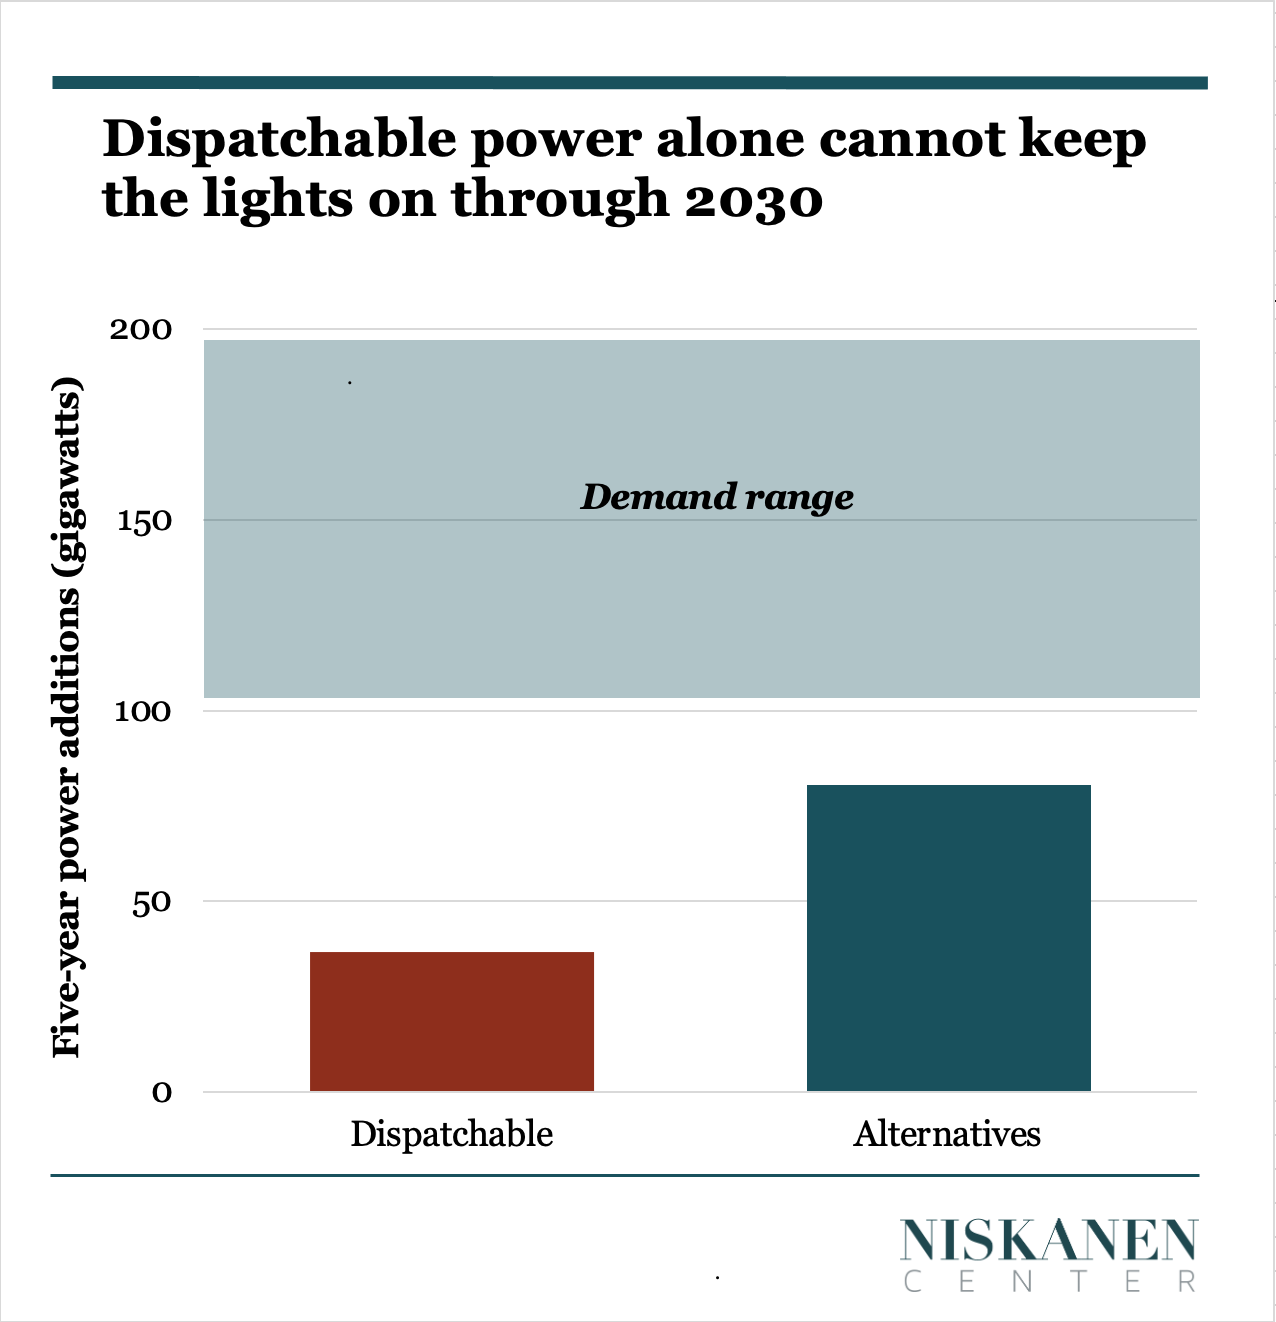
So if demand growth is on the low end of the estimates, then the grid would be able to deliver power dominance — enough supply to meet peak demands.
At least theoretically. If we’re counting on one source of energy to get the job done, the illustration below shows the literally darker reality:
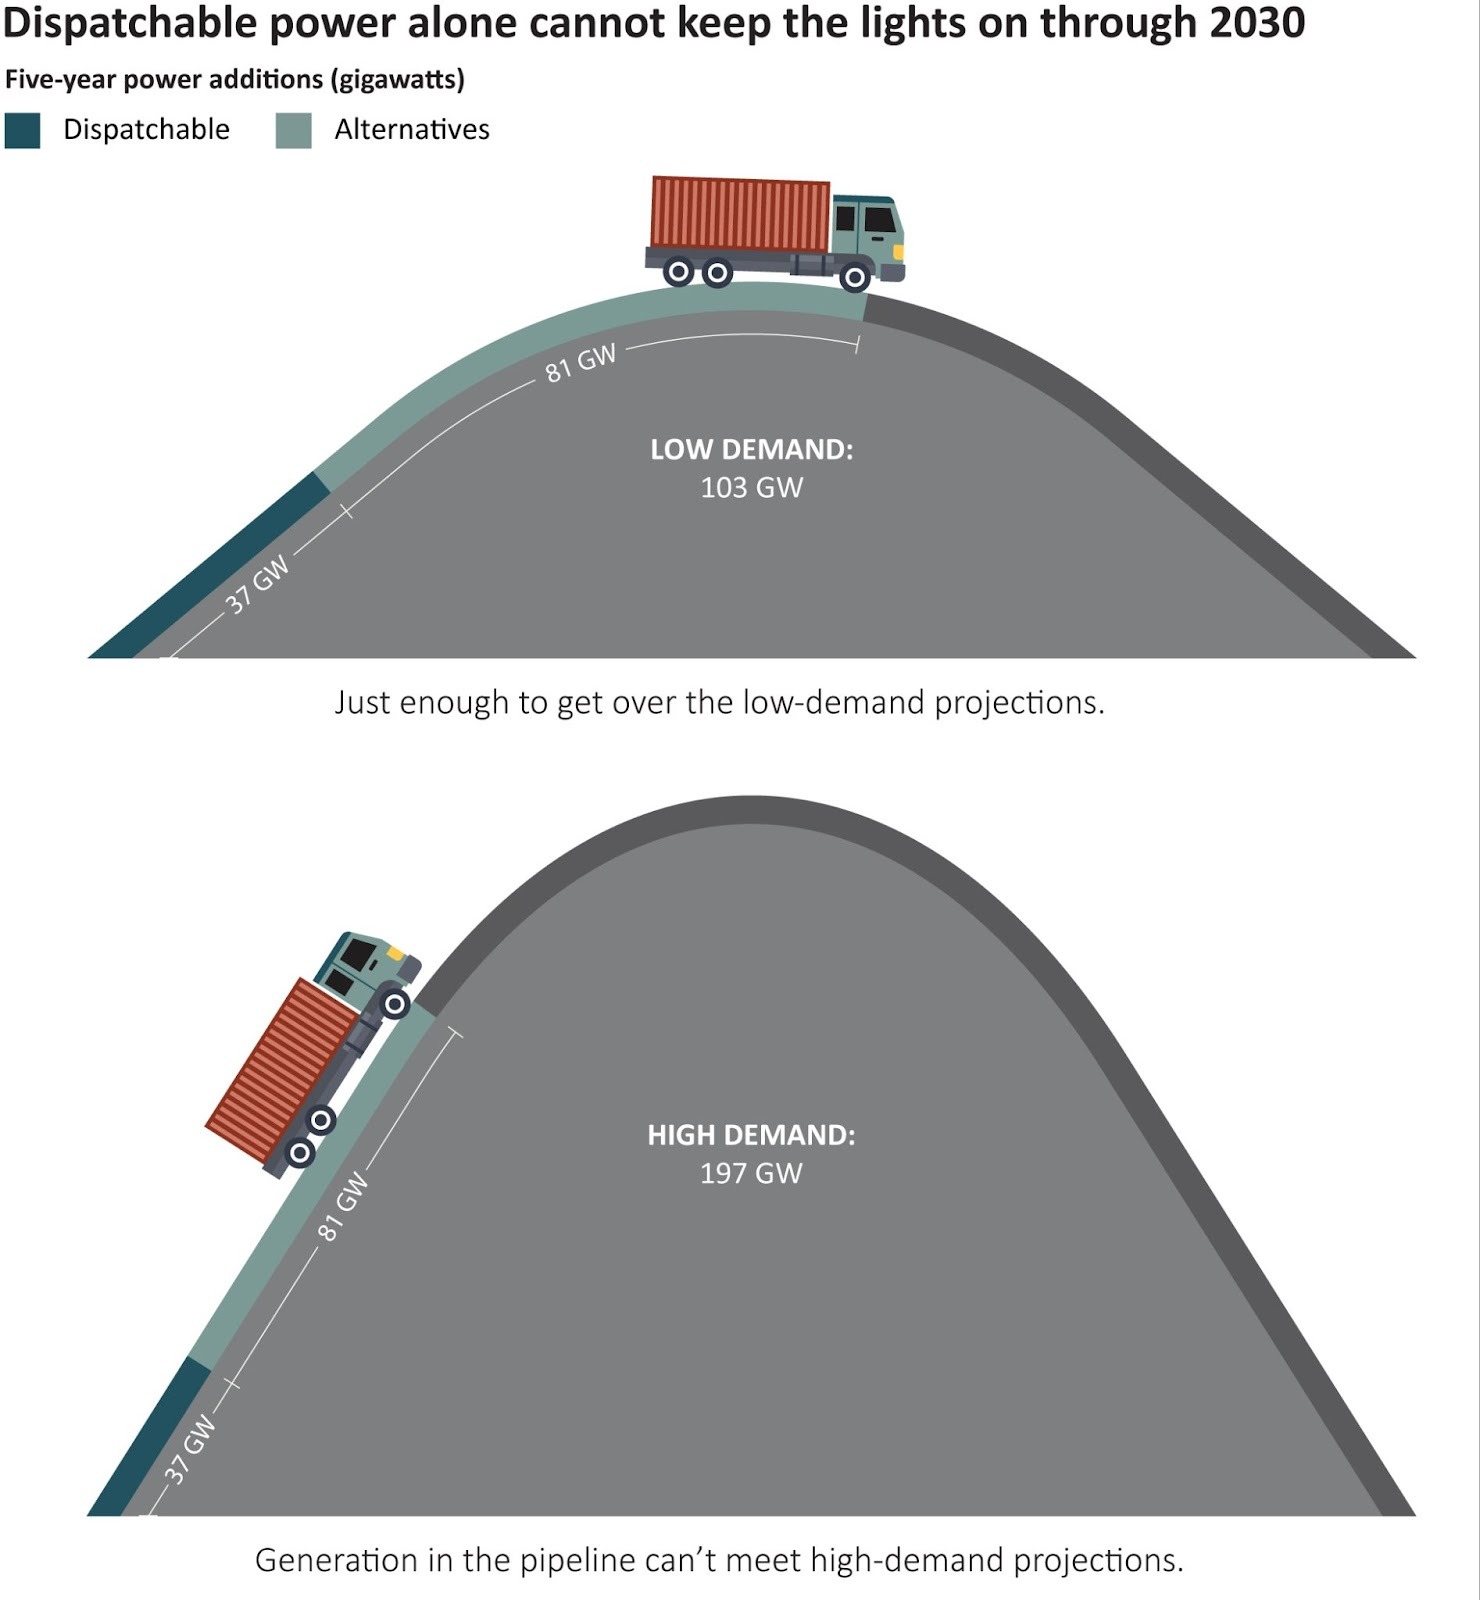
The combination of natural gas and nuclear capacity (“dispatchable” energy shown in the chart) would account for only 37 GW, a fraction of the total amount needed and far short of even the low end of the demand range. Wind and solar projects would contribute another 26 GW during demand peaks. The remaining 55 GW would come from electricity-storage projects and various hybrid power plants, such as solar paired with lithium-ion batteries.
Part 2: On the energy side, (not) going the distance
That’s the picture on the power side during peak demand. On the energy side, when we look at projections for cumulative electricity consumption throughout an entire year rather than only at peak moments, we also see additional demand growth ranging widely, from 449 terawatt-hours (i.e., 449,000 gigawatt-hours) to 855 terawatt-hours through 2030. That’s all new demand on top of current demand.
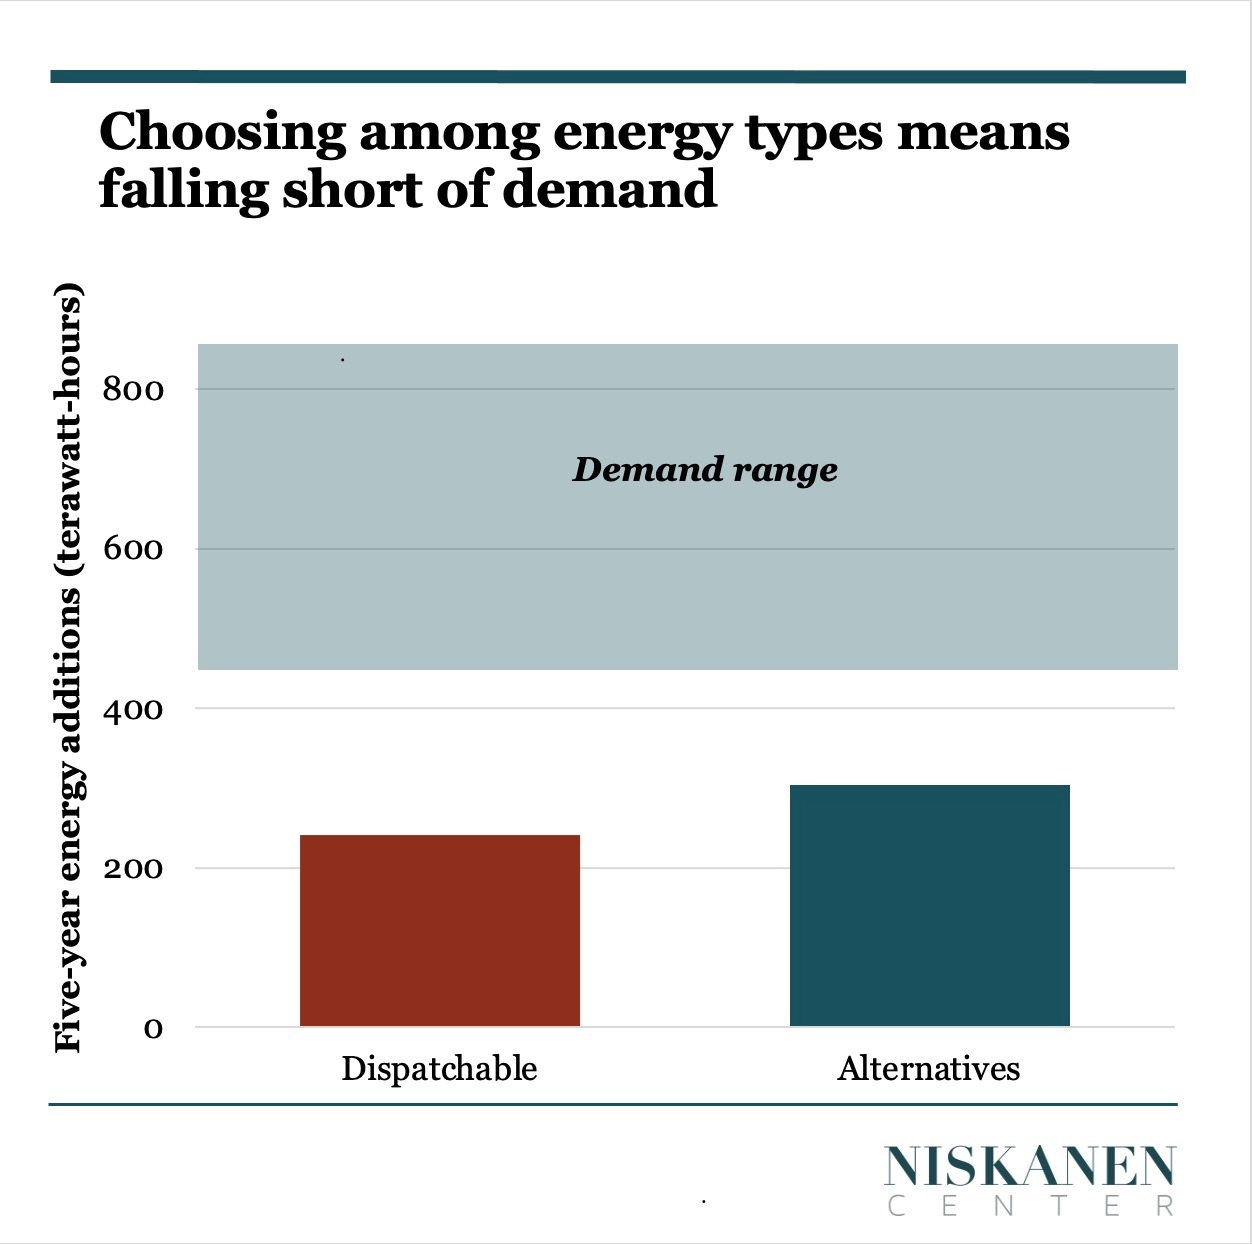
The chart below makes clear how far off we may be from meeting our growing energy needs over the next five years, even when all sources are combined.
The contributions to annual electricity supply from various production technologies are different from those for meeting the limited hours of peak demand. For example, battery storage on its own produces nothing and therefore doesn’t contribute to annual production, but it can help provide power during peak demand. On the flip side, wind availability is higher on average over the year than it is at peak, so it’s an essential tool for meeting our energy needs throughout the year. As another example, dispatchable sources make up almost half of expected annual production additions, more than their share of peak supply additions.
In other words, a given technology can have high value on the power side but low value on the energy side and vice versa, or medium value on both, for instance. This underscores why a diversity of technologies makes for the strongest grid.
Most importantly, the fundamental takeaway from the power side holds true here on the energy side as well: Excluding any given technology in the existing project-development queue would prevent us from keeping pace with additional electricity demand, even in the low-growth scenarios.
The inescapable point is that energy strategies that reject a balanced mix of sources won’t be enough to keep up with growth. We need to stop choosing among energy types and start embracing America’s energy-dominance potential.
In the next installment of our series on driving America’s energy future, we will examine practical strategies for leveraging readily available supplies to address accelerating demand.
Notes on our analysis
How did we arrive at our calculations?
Nationwide, we project the grid will need to provide between 103 and 197 GW more power by 2030 during peak times. The uncertainty in that range is due to data-center demand. A recent Department of Energy survey analyzed nine expert projections that ranged from 33 GW to 109 GW, with non-data-center load growth at 51 GW over the same period. We adjusted this range upward to reflect a buffer “reserve margin” that power systems are built to meet. For comparison, without a reserve margin adjustment, the Brattle Group, a global economics consulting firm, projected 175 GW of new demand growth; Grid Strategies, a power-sector consulting firm, projected 141 GW of demand growth. For cumulative consumption across the year, we exclude the reserve margin and assume growth rates equivalent to those at peak times.On the supply side, we project that only 118 GW of power capacity will come online by 2030 that is available at peak times. To project near-term capacity additions, we used Lawrence Berkeley National Lab datasets for active capacity in the interconnection queues and historical completion rates for queue applications. We adjusted for approved fast-track interconnection programs and a moderate reduction in clean-energy completions under the One Big Beautiful Bill Act that became law in July. We then adjusted all technologies to reflect their performance during peak demand periods. For annual production, we apply annual capacity factors by technology.