
Over the past century and a half, global average surface temperature has increased by about 1.5 °F. But the temperature increase is not constant year after year. Rather, it is superimposed with variability that can make the warming signal disappear or appear to accelerate for decades. A common critique of climate models is that they cannot explain these variations in the data. A new paper in Nature Geosciences approaches this issue, answering this common skeptical critique and finding a major role for ocean temperatures in the Pacific.
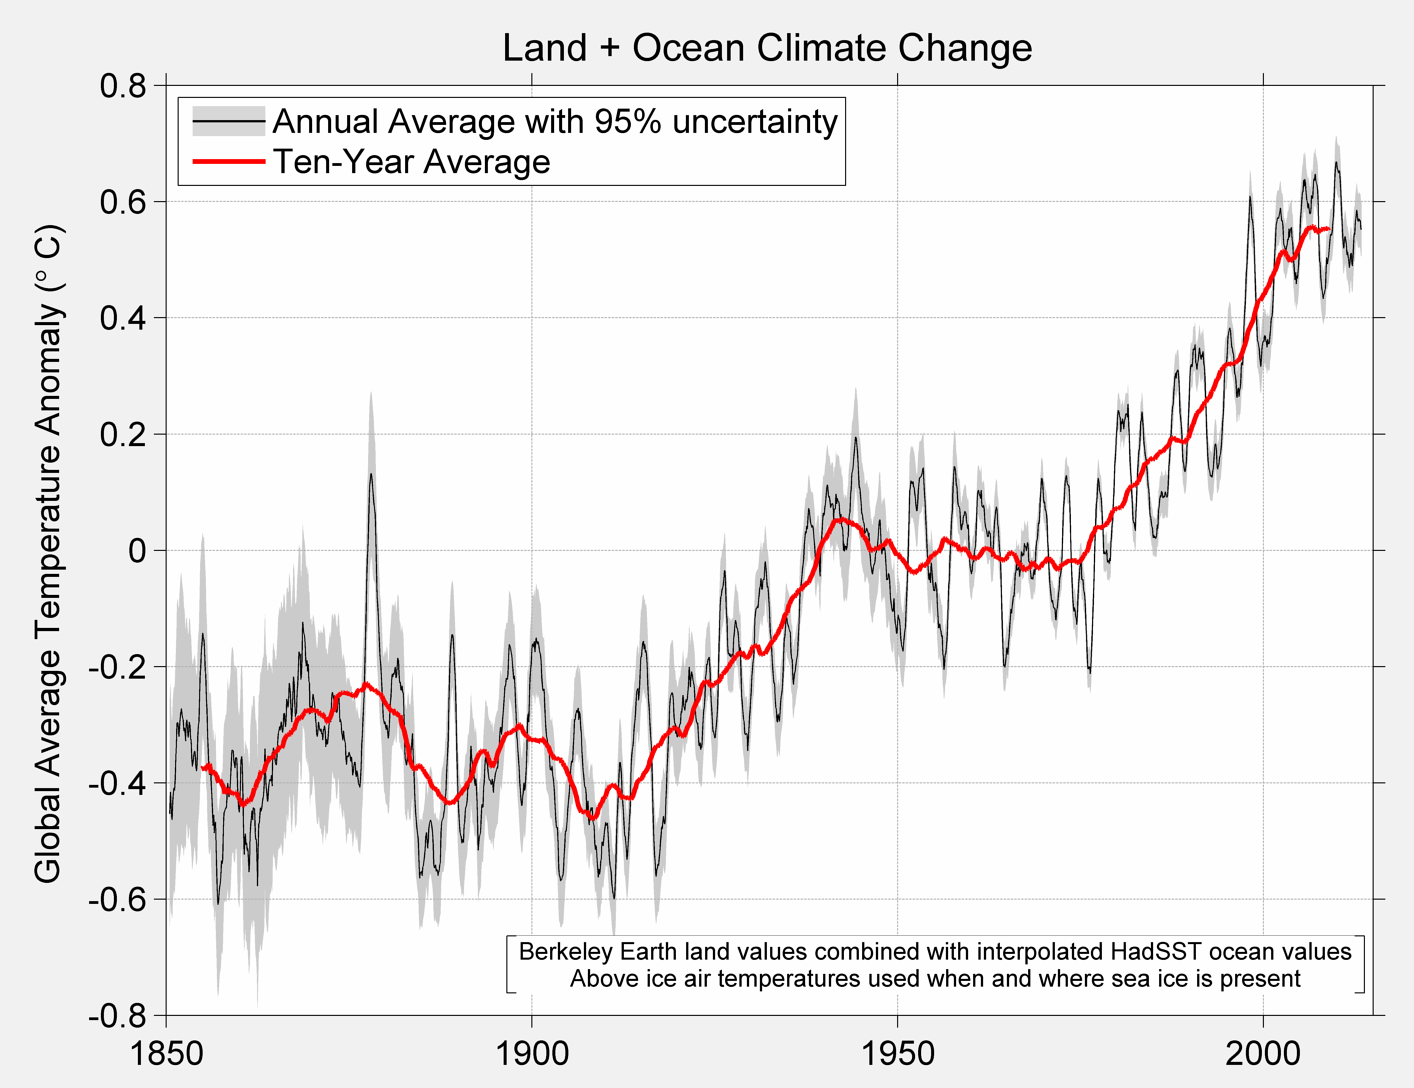
The observed global temperature increase looks more like a staircase than a ramp. Temperature has gone up in fits and starts over the 20th century; periods of relatively flat temperatures (circa 1945-1975, 1998-2013) punctuated by big increases (circa 1925-1945 and 1975-1998). The pattern is evident in the 10-year running average of global temperature (red line) in this diagram from Berkeley Earth.
Understanding the staircase is particularly important for understanding how much random variability has contributed to recent warming versus human influences. Judith Curry cited the rises and landings in the earlier part of the 20th century in her critique the IPCC’s finding that human influences are responsible for more than half of the warming since 1950. While these earlier periods are outside the claims of the IPCC statement, the point is valid that we need to know the character of natural variability to make claims about the extent of human influence on global temperatures.
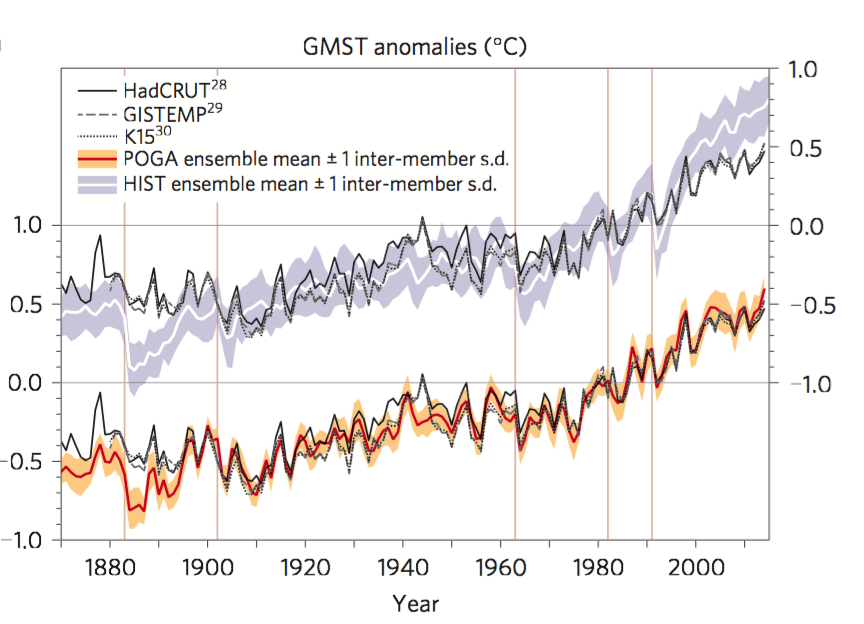
A new paper claims to have performed the first simulation of the 20th century where the temperatures produced by the model reflect the staircase of the real world. This diagram from the paper shows the comparison between what climate models typically simulate (the grey bands) and the results of their new simulation (the orange band). The orange band follow the actual temperature records (black lines) with much more fidelity than the grey, especially over the staircase landings from 1945-1975 and 1998-present.
This is important, because the model can help explain why warming starts and stops at certain times. The key conclusion of this work is that much of the variability in global temperature is being driven by ocean temperatures near the equator in the Eastern Pacific Ocean. By forcing a computer model to have the correct surface temperatures in that part of the ocean, the authors were able to recreate the fits and starts of global warming. And more than just matching wiggles in global average temperature, they showed how the variability in their model resembled the variability in the real temperature record—adding evidence to their case that this part of the Pacific is an important contributor to global temperature variability.
This paper argues that many of the steps and landings over the past century were generated by variability in the tropical Pacific. Hot events in the tropical Pacific contributed to the rapid warming between 1910-1930. Cold events contributed to, and extended, the ‘grand hiatus’ from 1945-1975 (which is also related to the cooling caused by particulate pollution). Following previous analysis, cold blasts in the tropical Pacific explain the recent temperature slowdown.
This paper presents a compelling case for the importance of the tropical Pacific in pacing the steps and landings in global warming driven by increases in greenhouse gases. When that variability is accounted for, their climate model is capable of recreating the starts and stops of global warming—including the recent pause—at the right times.
Climate skeptics frequently claim that studies of variability are discounted by the climate science community—apparently confident that natural variability could offer a better explanation for global warming than the canonical one. This study does consider variability, but finds almost the opposite. When the authors take this variability into account, it appears that basically all of the 20th century temperature increase can be chalked up to changes in the external factors that affect the climate, with human influences looming large.
Photo by Amol Mande from Pexels

