
2015 was the hottest year on record in all the major surface global temperature datasets (NASA GISS, NOAA NCDC, CRU HADCRUT4, Berkeley Earth), and the 3rd hottest year in the two satellite datasets (Remote Sensing System and University of Alabama at Huntsville).
By now it is no secret that 2015 was an El Niño year. El Niño conditions increase the global temperature and we know that 2015 saw the onset of a strong El Niño event (an expression of a phenomena called the El Niño Southern Oscillation, or ENSO). Was the 2015 record due to global warming or simply the fact that a large El Niño elevated global temperatures?
We know of three major sources of natural variability that influence the global temperature signal on decadal timescales: El Niño, solar intensity, and aerosols from dust (mainly volcanoes). In 2011, a paper by Foster & Rahmstorf (FR2011) sought to remove these three factors from temperature records to see if there was an otherwise strong natural contribution (increasing or decreasing global temperatures) in the modern global warming signal.
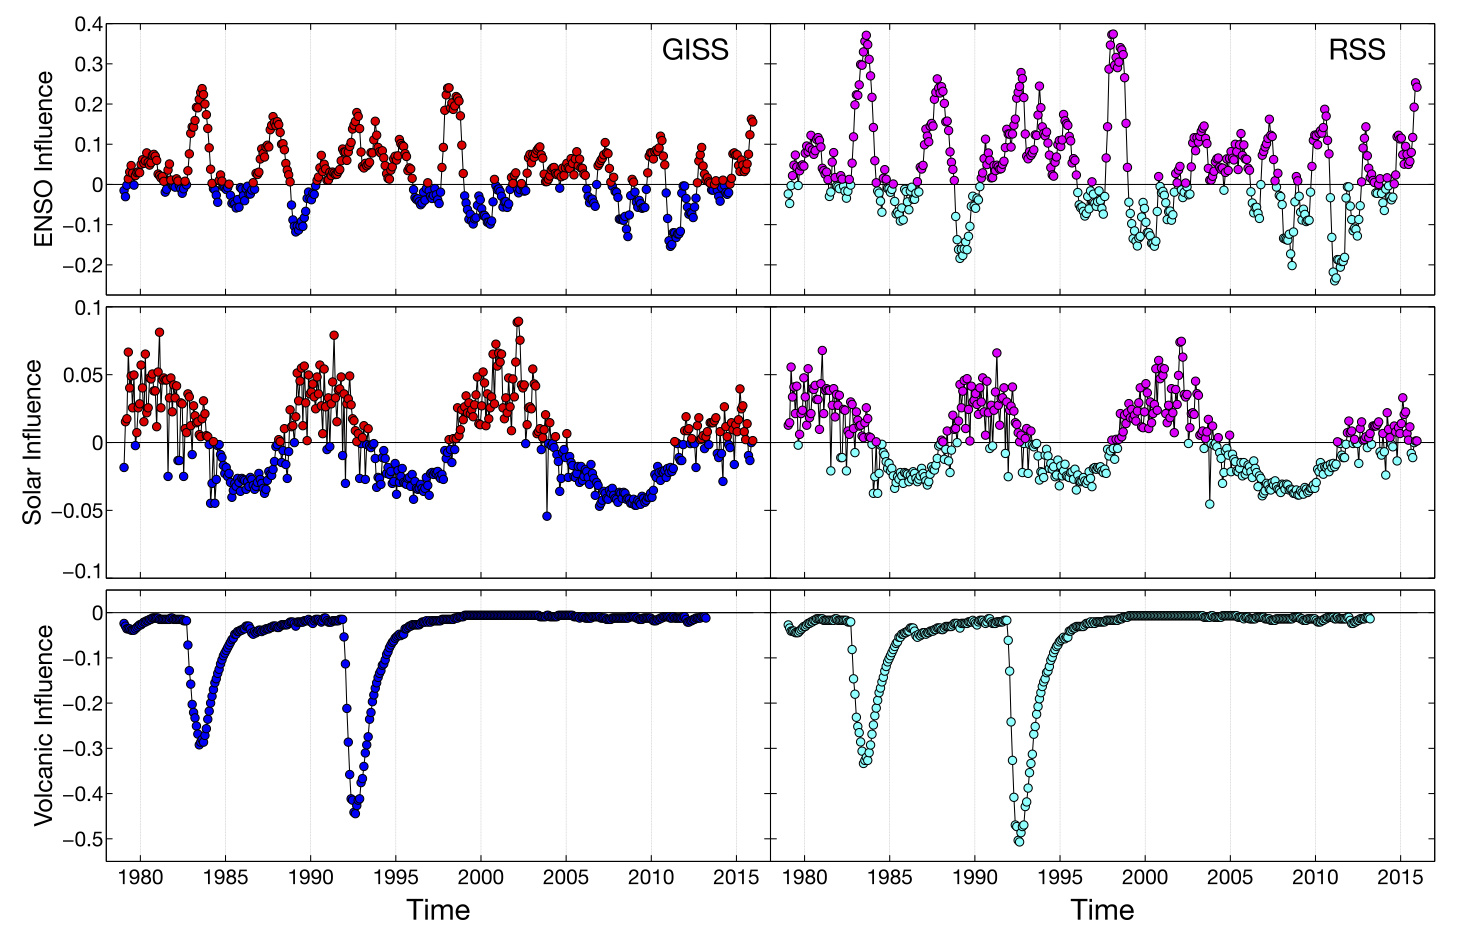
Here, I replicate the FR2011 analysis using data up until the end of 2015. Figure one illustrates the influence of El Niño, solar and volcanic aerosol forcing on the GISS (the fastest warming surface record) and RSS (the slowest warming satellite record) temperature records.
Figure 1: The influence (deg.C) of ENSO, solar and volcanic forcing on the NASA GISS (left panels) and RSS (right panels) monthly global temperature records using the FR2011 methodology. Red and magenta indicate a warming effect, blue and cyan indicate a cooling effect.
Figure 1 indicates that since about 2012, both solar forcing and El Niño have added to global temperatures, and there has been zero/negligible volcanic forcing. Solar forcing has contributed less than 0.05 °C. The recent El Niño has contributed ~0.1 °C of warming to the GISS monthly temperature values throughout 2015. NASA GISS, however, reports that 2015 beat the 1951-1980 base period average by 0.87 °C and the previous record (2014) by 0.13 °C.
This contribution from ENSO is congruent with an analysis presented at Climate Central. El Niño helped, but the record came from the overall warming trend. Simply put, there is one major reason behind 2015 temperatures – global warming.
Natural factors other than the big three mechanisms—such as the Arctic Oscillation—can influence local monthly and yearly temperature patterns. But they typically redistribute heat across the globe and do not alter the global energy balance. Hence, these natural factors do not influence the global temperature record like El Niño, the sun, and volcanos.
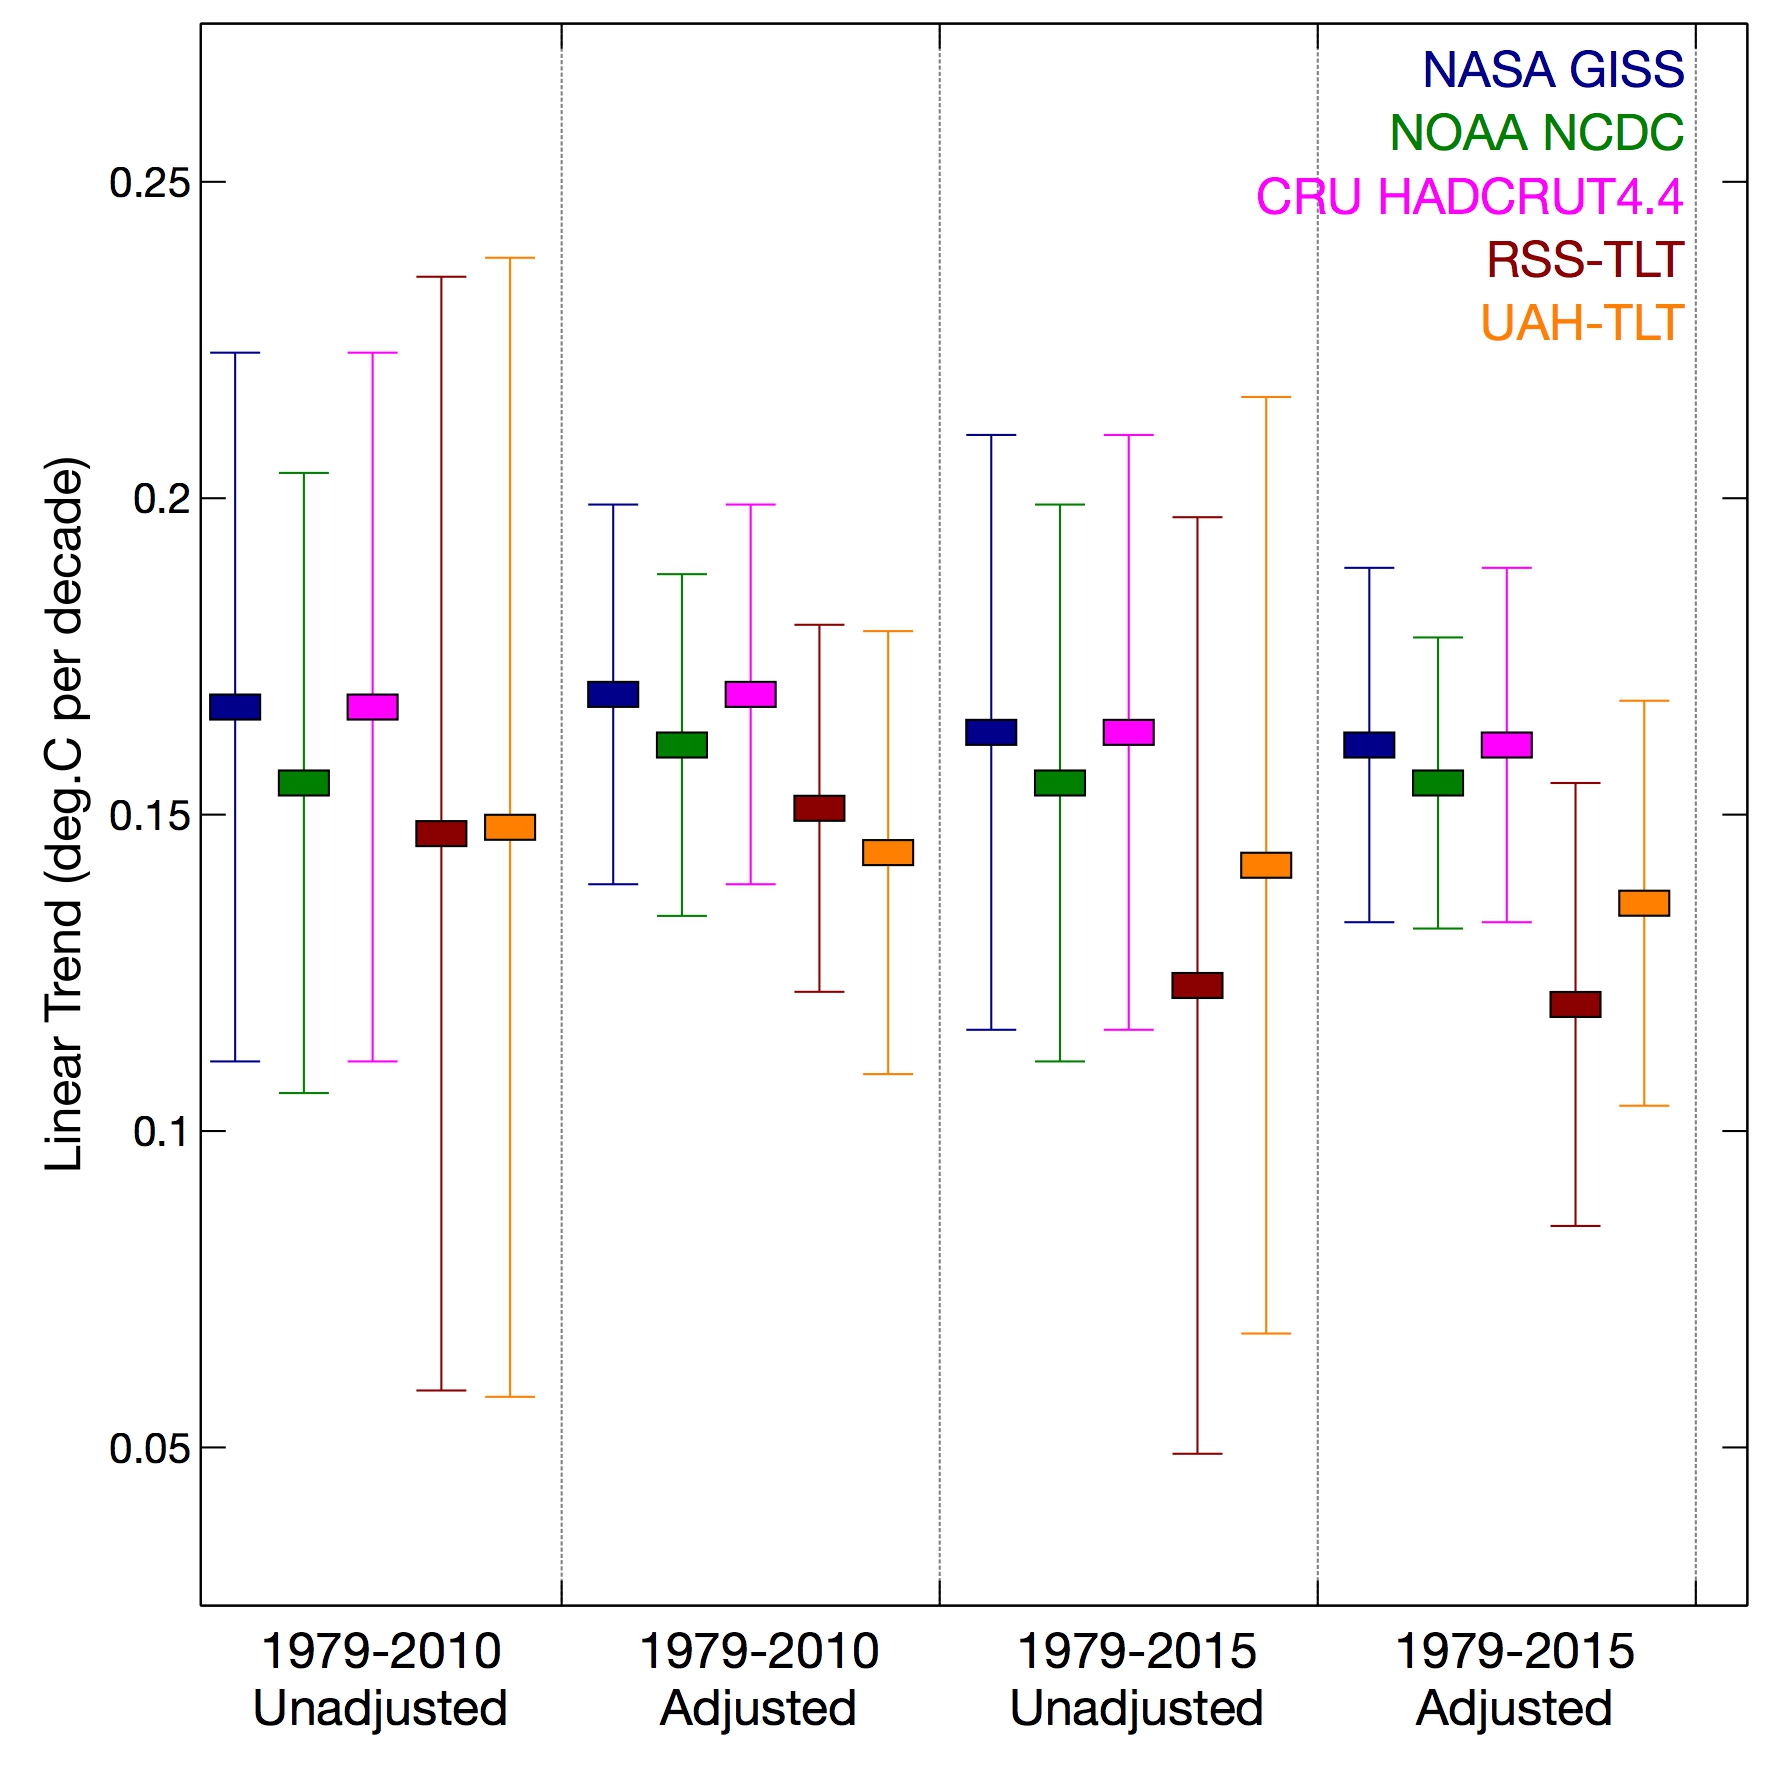
Irrespective of the ranking of 2015 in any dataset, the important message is that the underlying trend in global warming remains constant, as demonstrated in figure 2. In fact, the warming in all five datasets since 1979 is statistically distinguishable from zero. If 2016 also turns out to be a very warm year due to the continued ENSO influence, then there may even be a surge in temperature increases.
Figure 2: Temperature trends (deg.C per decade) all show significant warming (beyond 2 standard errors) from 1979-2015, with or without adjustment for El Niño, volcanic, and solar activity.
Climate skeptics have already responded to the news that 2015 broke heat records by invoking the warming power of El Niño, saying that without that 2015 might have been any other year. But even with the warming effect of El Niño, it’s a record hot year, at the end of a record busting period (15 of the hottest 16 years on record came after the year 2000), and further evidence of an ongoing warming trend that spans decades. All of that is consistent with the picture of ongoing human-caused climate change as a result of carbon dioxide emissions.
[Image Source: NOAA]


