Introduction
Families with young children are potentially eligible for dozens of public benefits to support them during periods of unemployment and to supplement their earnings during periods of employment. Access to these benefits varies depending on earnings, marital status, age of the children, and where families reside. This patchwork across programs and states is so complex that social scientists, advocates, and policymakers often narrow their focus to examine a single program in isolation. While this gives a clear view of the impact of any one program, it risks missing the forest for the trees.
The reality is that families do not experience these programs one at a time, but as an interactive system. This annual report card develops a more holistic understanding of family benefits, their impact on family resources, and how those resources support families as parents’ employment circumstances shift and evolve over time. We have expanded our analysis to all 50 states, calculating the cumulative impact of six major benefit programs on two types of families, and examining how their family benefits change as they move into the labor market and climb the economic ladder.
America’s family benefit patchwork
Families with children may find themselves benefiting from two sets of social policies that provide cash or benefits similar to cash. One set comprises traditional social assistance programs and includes Temporary Assistance for Needy Families (TANF) and the Supplemental Nutrition Assistance Program (SNAP). These are federally supported programs that are administered by states and aimed at assisting families whose breadwinners are unemployed and attempting to reenter the workforce. The other set of policies consists of refundable tax credits, which essentially are benefits administered through the tax code. They include Earned Income Tax Credits (EITC) and Child Tax Credits (CTC). The federal government and many states independently run their own tax credit programs.
Two aspects of these programs are especially important: the maximum benefit amount, and the implicit marginal tax rate (IMTR) that they may impose on families. In cases in which families receive more than one benefit, these supports can create a cumulative benefit level much higher than for any given program in isolation. The most common example is that a family receiving TANF benefits is very likely to be receiving SNAP benefits as well. Evidence suggests that participation in multiple programs is common.
To fully understand families’ economic circumstances, we need to know how much they may be receiving in total benefits across multiple programs in any given situation. We also need to know what kind of work incentives or disincentives they may be facing. Implicit marginal tax rates show the benefits that families lose (or gain) on each additional dollar of earnings. Income-tested programs such as TANF, SNAP, and EITC are available only to those with low or moderate earnings. As earnings increase, these benefits begin to phase out or even abruptly end. In cases in which families receive more than one income-tested benefit, these implicit marginal tax rates can stack on top of each other, creating a cumulative IMTR much higher than for any given program in isolation. The most obvious example is the phaseout of state EITCs simultaneously with the federal EITC.
In some cases, workers face “benefit cliffs” in which IMTRs climb to 100 percent and above. An additional dollar of earnings may result in workers losing their entire benefit — potentially worth hundreds or thousands of dollars — leaving them worse off than they would have been if they had earned less. Social scientists and policymakers have recognized for decades that high IMTRs can trap low-income families with children in poverty.
We provide a brief overview of each of these programs before delving into our analysis.
Social assistance: TANF and SNAP
TANF and SNAP are the two primary social assistance programs designed to boost the incomes of low-income families. Both are income tested, meaning they are available only to households whose incomes fall below a certain level.
Since the 1996 welfare reforms, TANF has been a state program that follows broad federal rules and is funded partially by federal block grants. Among other benefits, it provides cash assistance to families in need. In 2025, the maximum monthly benefit for a single parent with one child ranged from $162 in Arkansas to $1,057 in New Hampshire (Figure 1). States vary on how they determine benefit levels. Some states set the maximum benefit in nominal terms and make occasional statutory adjustments, while others index benefit levels to inflation or the federal poverty threshold. States phase out TANF benefits based on a combination of earnings disregards and maximum earnings thresholds, creating IMTRs that vary widely across states.
SNAP, formerly known as “food stamps,” is a federal program administered by the states. Introduced in 1964, SNAP has evolved into an income-tested “near cash” benefit for low-income households. States issue an electronic benefit transfer (EBT) — basically, a debit card for food purchases — to eligible households based on number of family members, income, and other factors. In 2025, the maximum monthly benefit for a single parent with one child was $546 in the contiguous 48 states.
The basic SNAP program has a gross income limit equal to 130 percent of the federal poverty level (FPL). Most states, however, have taken advantage of the option to expand it up to 200 percent of the FPL by using what is called broad-based categorical eligibility (BBCE). The SNAP phaseout rate varies based on a set of income tests and deductions for basic expenses. For most households, this creates IMTRs in the range of 24 percent to 36 percent for each additional dollar earned. In some cases, households face a benefit cliff when earning an additional dollar can lead to the loss of their entire SNAP benefit. Most states mitigate this effect by using BBCE to provide a longer runway to phase out benefits.
Refundable tax credits: EITCs and CTCs
The EITC is a refundable, income-tested tax benefit that phases in with earnings until reaching a maximum benefit that varies based on the number of children in a household ($4,328–$8,046 in 2025). It plateaus briefly before phasing out again for single parents earning more than $23,350 and for married parents earning more than $30,470. Twenty-seven states have state-level refundable EITCs to supplement the federal credit. Nearly every state sets its EITC at a percentage of the federal credit, with rates ranging from 4 percent in Wisconsin to 50 percent in Colorado.
The EITC’s implicit marginal tax rates differ depending on household earnings and number of children. For very low-income families, the IMTR is negative, as the credit phases in with earnings. For workers in this range, each additional dollar earned results in an additional 34 cents (one child), 40 cents (two children), or 45 cents (three or more children) in benefits up to a certain amount. They then face a 0 percent IMTR in the plateau range. After families reach the next earnings threshold, the credit begins to phase out at a rate of either 15.98 percent (one child) or 21.06 percent (two or more children).
States that set their EITC as a percentage of the federal credit adhere to the same threshold structure, which results in varying IMTRs depending on the state’s maximum credit amount. These usually push the cumulative IMTR up or down 1–5 percentage points, depending on the specific state details.
The CTC is a refundable tax benefit for families with children under 17. In 2025, the credit was worth up to $2,200 per child. It begins to phase out at 5 percent for single parents making more than $200,000 and married parents making more than $400,000. These IMTRs affect fewer families because they are set so high. As with the EITC, the federal CTC phases in with earnings for low-income families. The first $1,700 of the CTC is refundable, phasing in at 15 percent per household after $2,500 in earnings. Any credit remaining is nonrefundable and phases in depending on a household’s tax liability. Because the $1,700 cutoff for refundability applies even for filers with more than one child, each additional child means the household must have higher earnings (and thus a greater tax liability) to claim the full credit. As with the EITC, for low-income families, this creates negative IMTRs that vary with household size. High-income families face a 5 percent IMTR as the credit phases out.
Eleven states offer state-level refundable CTCs to supplement the federal credit. In contrast to state EITCs, state CTCs are almost always set independent of the federal CTC. The credit is fully refundable in all of these states, which makes the full benefit available to families without earnings.
Maximum benefits range from $440 per child in Massachusetts to $4,473 per child in Colorado. Most states with refundable credits target the credit toward younger children. Age eligibility ranges from children under 4 years old to those under 17.
The most common structure — a fully refundable credit with no phase-in — creates a zero percent IMTR for the lowest-income families. But states vary widely in phaseout thresholds and rates. Thresholds range from $15,000 in Maryland to a universal credit in Massachusetts. Phaseout rates range from zero percent in Massachusetts to benefit cliffs (where earning an additional dollar can result in the loss of all or a substantial amount of the credit) in Colorado, Maryland, New Jersey, and New Mexico. As a result, IMTRs vary widely depending on the state’s credit structure and household earnings.
Measuring benefits and IMTRs for families with young children
For all 50 states, we evaluate total benefits and implicit marginal tax rates that families with young children face when their earnings increase. We consider six major benefits:
- TANF
- SNAP
- federal and state EITCs
- federal and state CTCs
We use TANF data from Policy Engine’s TANF calculator, SNAP data from SNAP Screener, and EITC and CTC data collected from various state and federal tax codes. These six are the most basic cash or near-cash programs that families encounter and, with the exception of TANF, have relatively high take-up rates.
We center our evaluation on two income zones: welfare to work, and climbing the ladder. We will first explore the benefit changes and IMTRs that arise when families move from welfare to work, which we operationalize as $0 earnings and earnings from working full time for the relevant state minimum wage. While numerous studies have examined the barriers families face when they transition from welfare to work, there is less research on the impact on benefits and IMTRs that upwardly mobile families face when they begin earning beyond the minimum wage. For this reason, we also look at families climbing the economic ladder and the changes associated with the transition from a state’s minimum wage to its median wage. Together, these two zones provide us with a fuller picture of total household income (earnings plus benefits) when families advance economically.
Welfare to work: Policymakers tend to focus on the advantages and barriers that families encounter when they move from welfare to work. We first evaluate the benefits and implicit marginal tax rates that arise when a person with zero income begins working full time at a state’s minimum wage. It is important to look at these rates on a state-by-state basis because minimum wages vary widely among states and may interact with EITCs and CTCs in unexpected ways. Some benefits may be phasing in with earnings while others may be phasing out in ways that could affect decision-making, depending on the specific state environment.
Climbing the ladder: Policymakers also often view minimum wage work as a stepping stone that allows low-wage workers to develop their skills, receive raises and promotions, and ultimately increase long-term earnings. But, as some evidence suggests, they have inadvertently created new barriers to upward mobility for these same families by pushing them to the phaseout threshold for many means-tested programs. We evaluate the benefits and implicit marginal tax rates that arise when a household with one parent working fulltime at the state’s minimum wage begins earning the full-time equivalent of the state’s median wage.
We consider two family structures: a single parent with one child, age 5, and a married couple with two children, ages 3 and 5. We assume both are single-earner families with one parent working full time at the state’s minimum wage or median wage or is unemployed. We focus on families with young children because it allows us to capture the most crucial years of child development and because parental earnings are typically lower at this stage of life.
We made several additional assumptions when modeling various benefits. Refundable tax credit calculations are relatively straightforward, requiring adjustment only for family size and marital status. For TANF calculations, we assumed that households pay for shelter, have no special needs, and reside in the most populated area of the state. For SNAP, we assumed that 1) no one in the household was over 60 or had a disability; and 2) households did not pay any utilities or monthly homeowners insurance but did pay rent equal to the fair market rent for a two-bedroom residence in the state’s largest metro area (40 percent of the area’s median rent). For both TANF and SNAP, we assumed that recipients had no unearned or uncounted income such as investment income, Social Security, child support, or unemployment benefits.
This approach does have important limitations. By focusing exclusively on these benefits, it excludes several other family benefits (e.g., rental assistance, child care assistance, and state-level nonrefundable CTCs) as well as traditional tax policies (e.g., payroll taxes, income taxes) that may affect a family’s IMTRs and total disposable income. Despite these limitations, we believe it provides us with a clear and comprehensive picture of family benefits in America.
National trends
Social assistance programs are the main source of income for families with no earnings, while refundable CTCs are playing an increasingly important role in boosting incomes at the bottom. Refundable credits are the primary supplement to earnings to lift families with minimum-wage and median-wage workers above the poverty line.
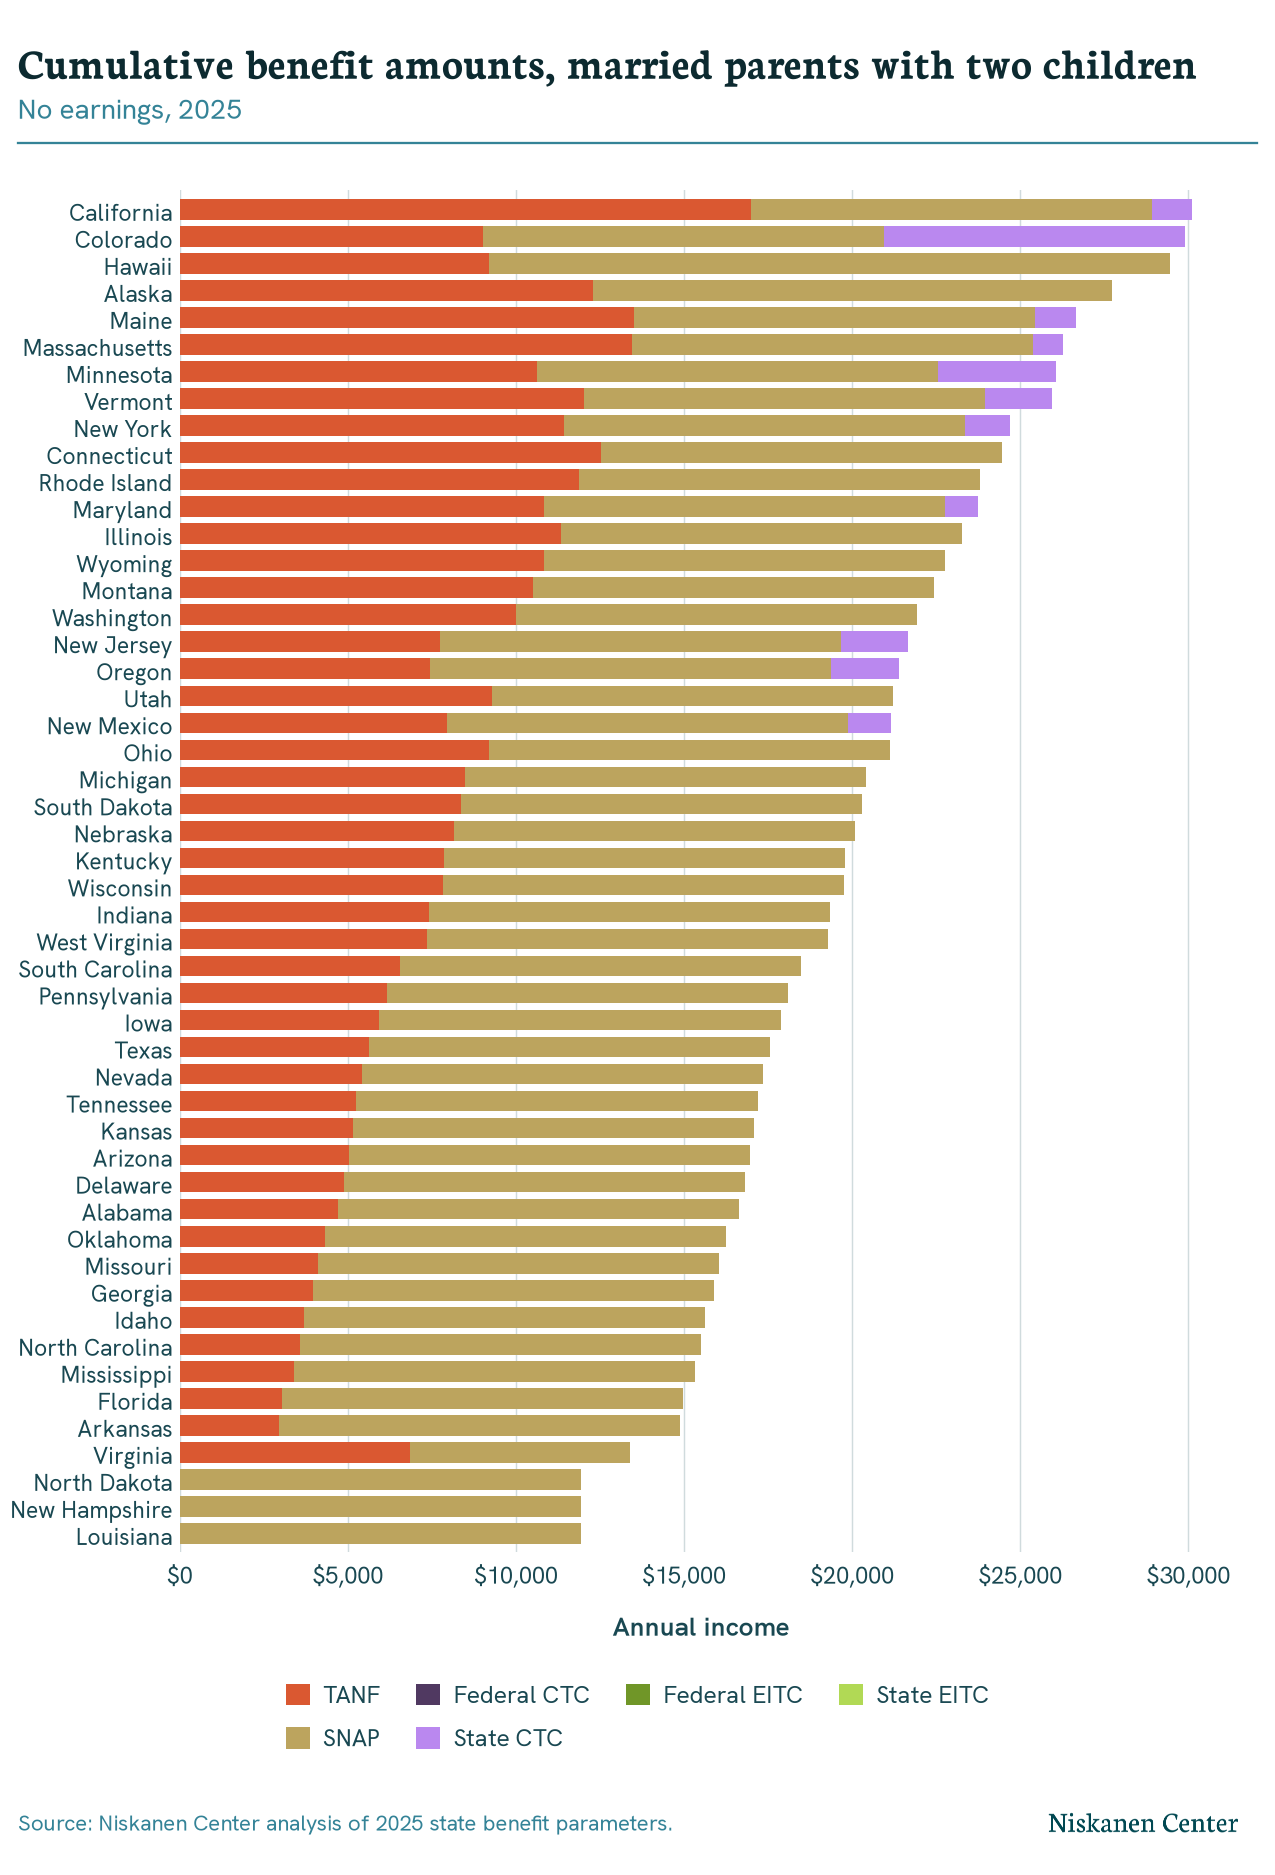
For families with no earnings, total benefits from social assistance and refundable tax credits ranged from $8,448 in Florida to $19,236 in New Hampshire for a single parent with one child, and from $11,928 in Louisiana, North Dakota, and New Hampshire to $30,109 in California for married parents with two children. Total incomes put these families between about 37 percent and 94 percent of the federal poverty threshold in 2025.
Figure 1: Income breakdown for single parent with one child, no earnings
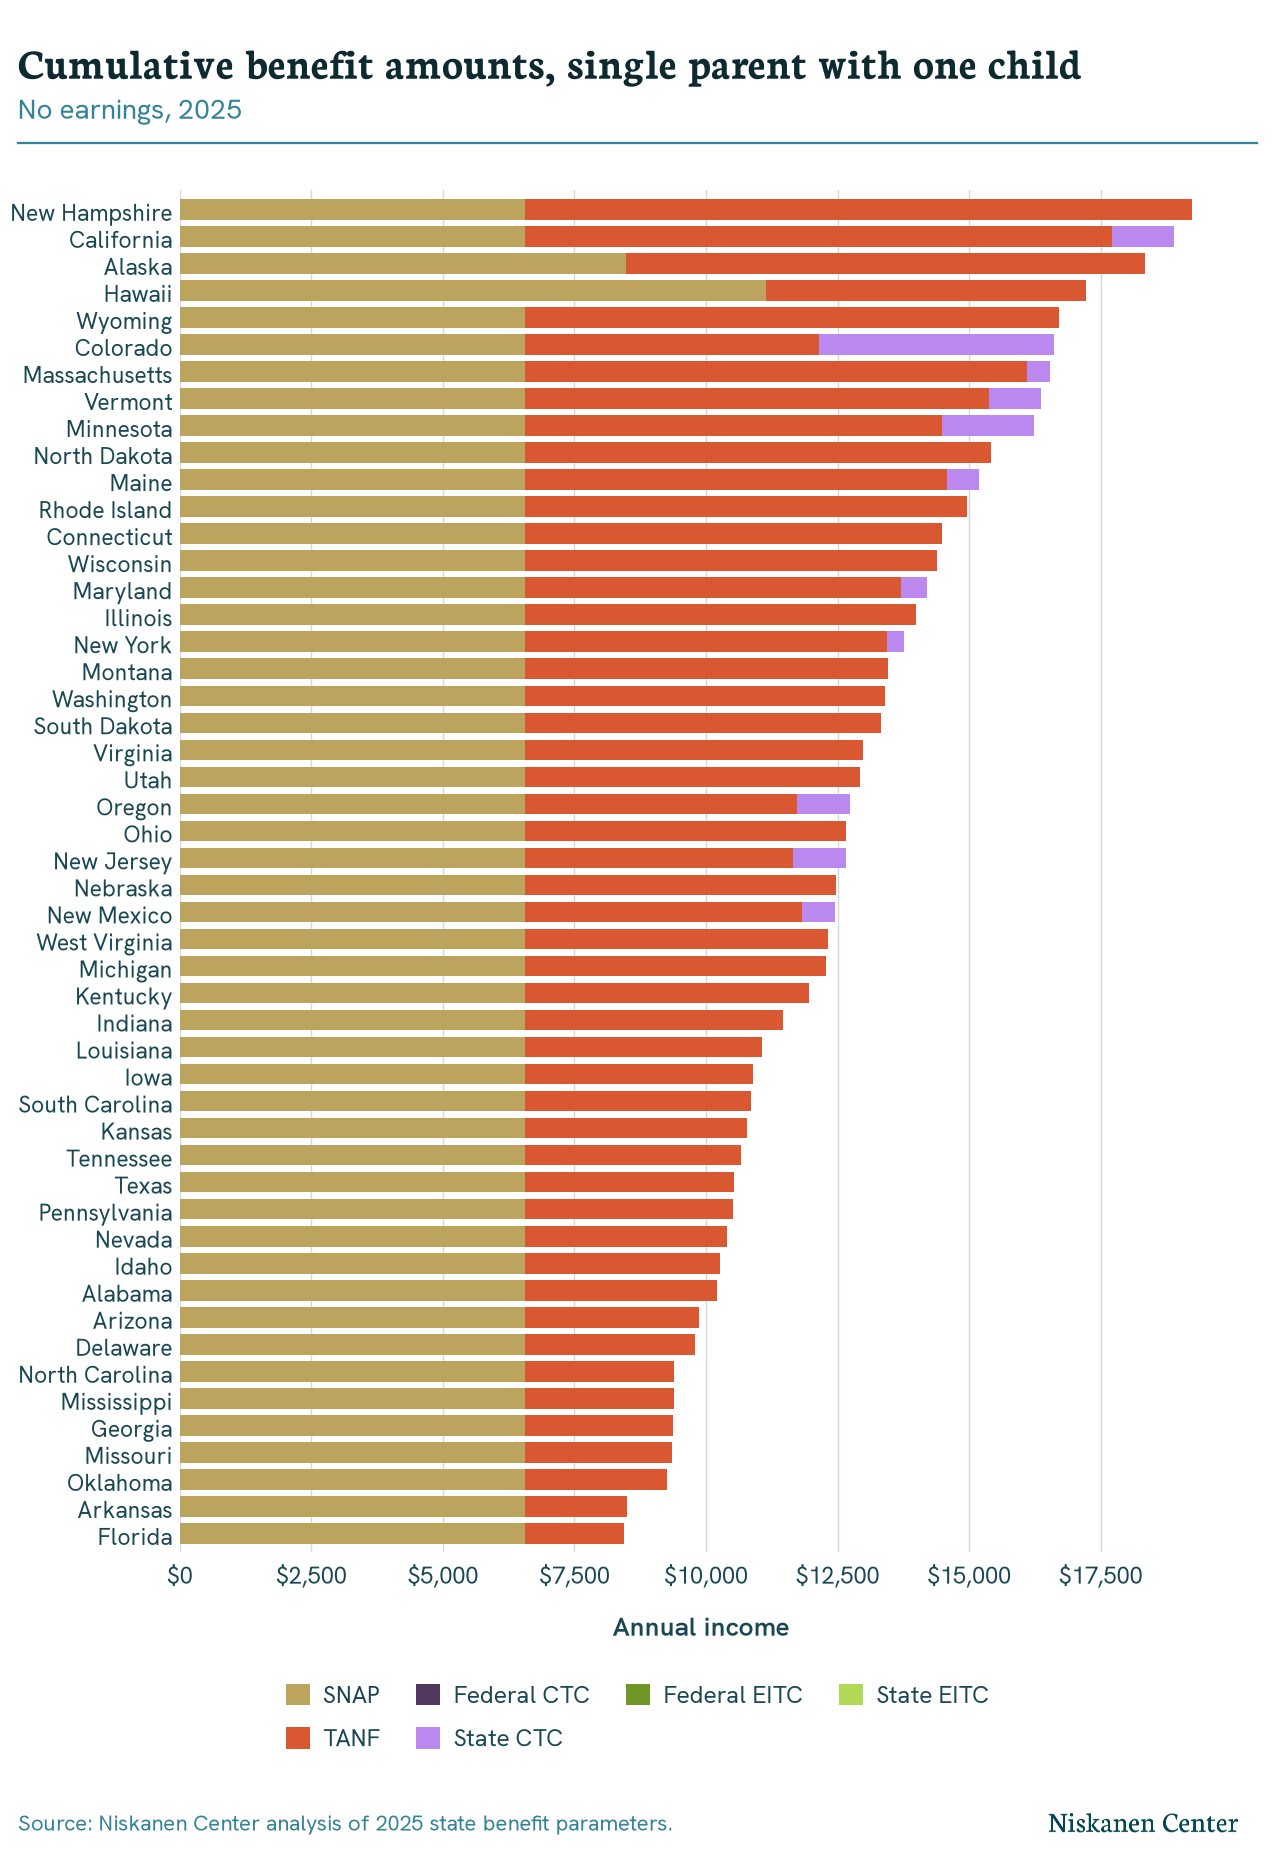
Figure 2: Income breakdown for married parents with two children, no earnings
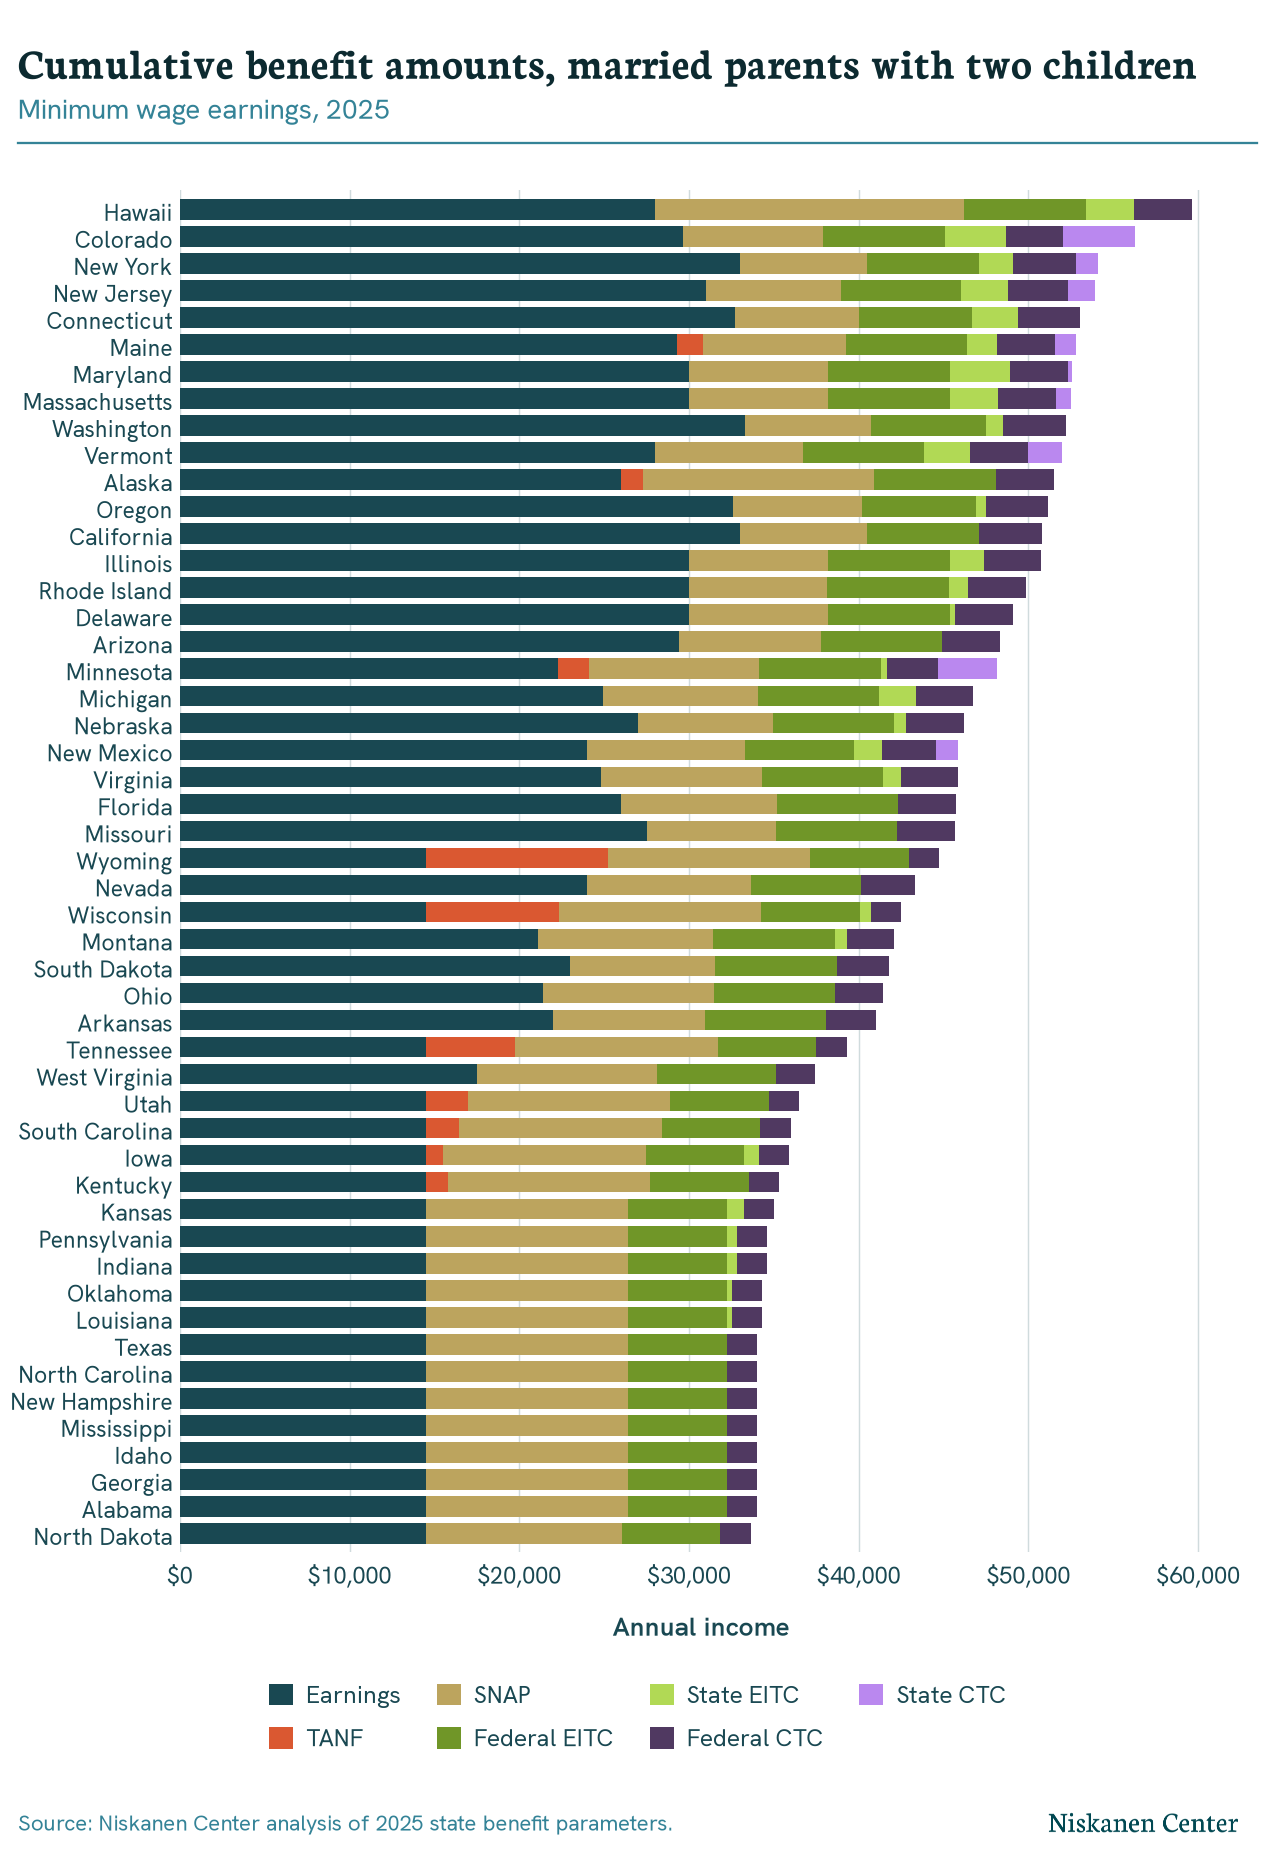
For families in which one parent is working full time at the state minimum wage, total income from earnings and the six programs examined here ranged from $26,726 in Alabama to $44,327 in Hawaii for a single parent with one child and $29,054 in North Dakota to $59,641 in Hawaii for married parents with two children. Total incomes put these families between about 105 percent and 210 percent of the federal poverty threshold in 2025.
Figure 3: Income breakdown for single parent with one child, minimum wage earnings
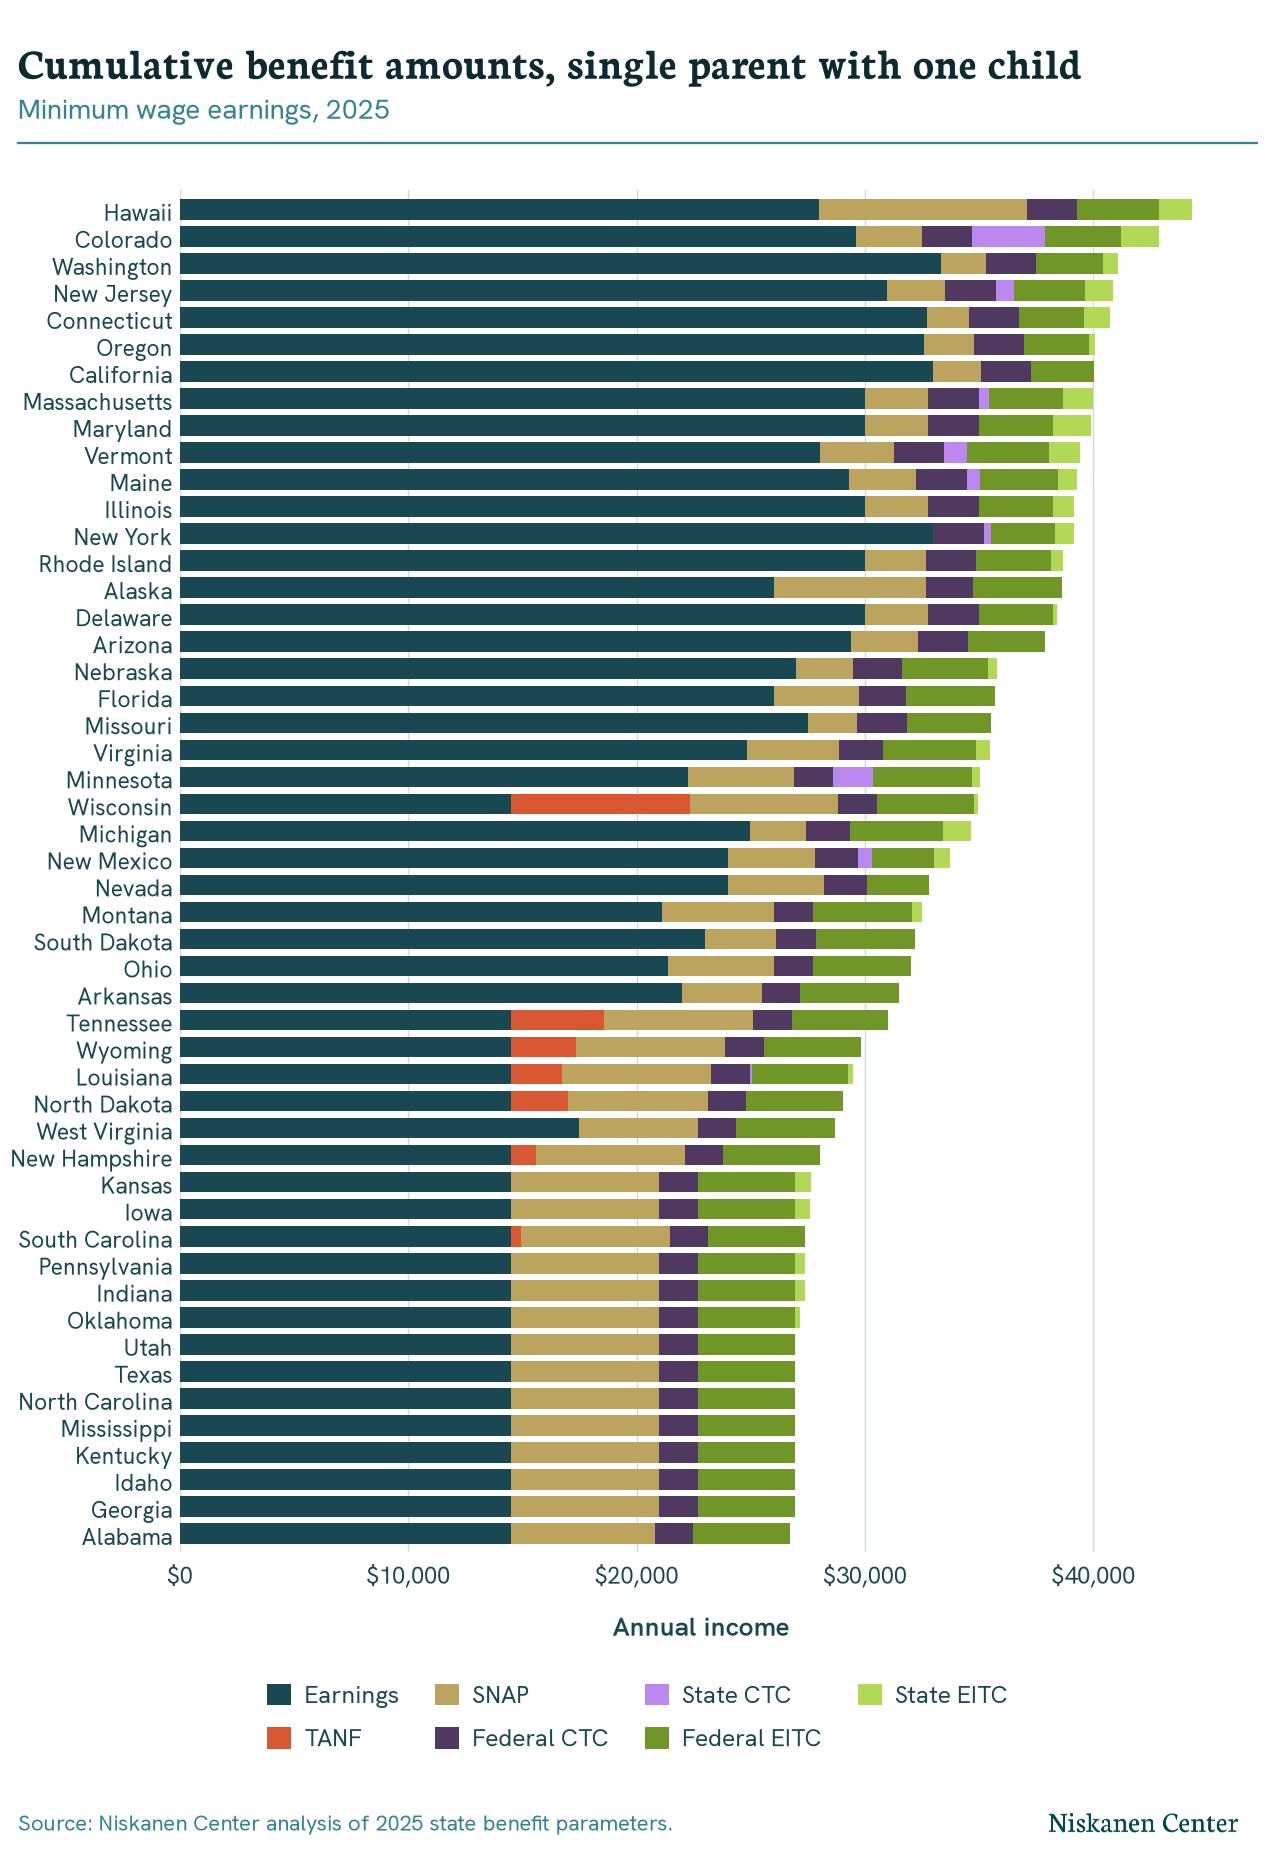
Figure 4: Income breakdown for married parents with two children, minimum wage earnings
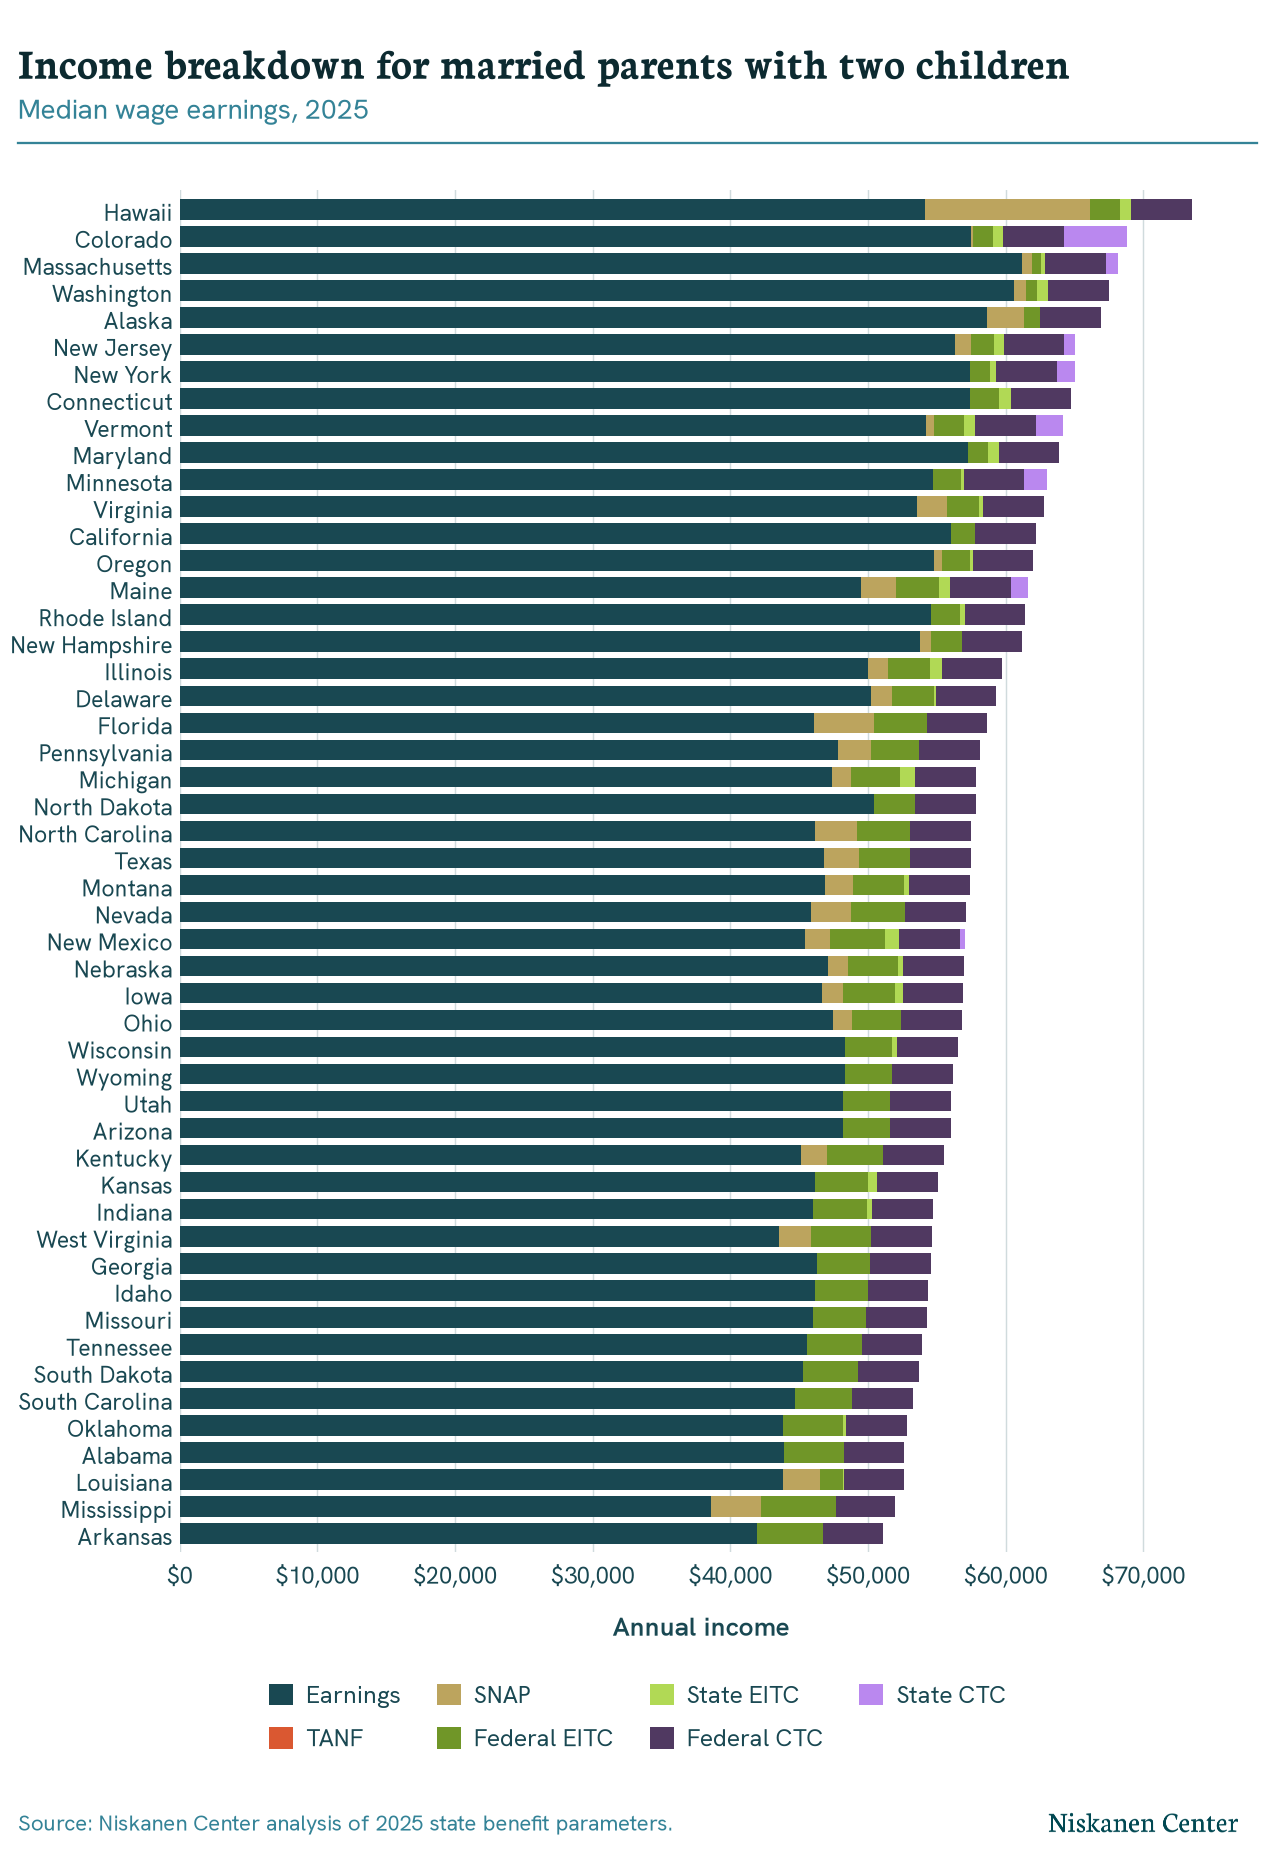
For families in which one parent is working full time at the state median wage, total income from earnings and the six programs examined here ranged from $42,674 in Mississippi to $63,780 in Massachusetts for a single parent with one child, and $51,092 in Arkansas to $73,528 in Hawaii for married parents with two children. Total incomes put these families between about 159 percent and 302 percent of the federal poverty threshold in 2025.
Figure 5: Income breakdown for single parent with one child, median wage earnings
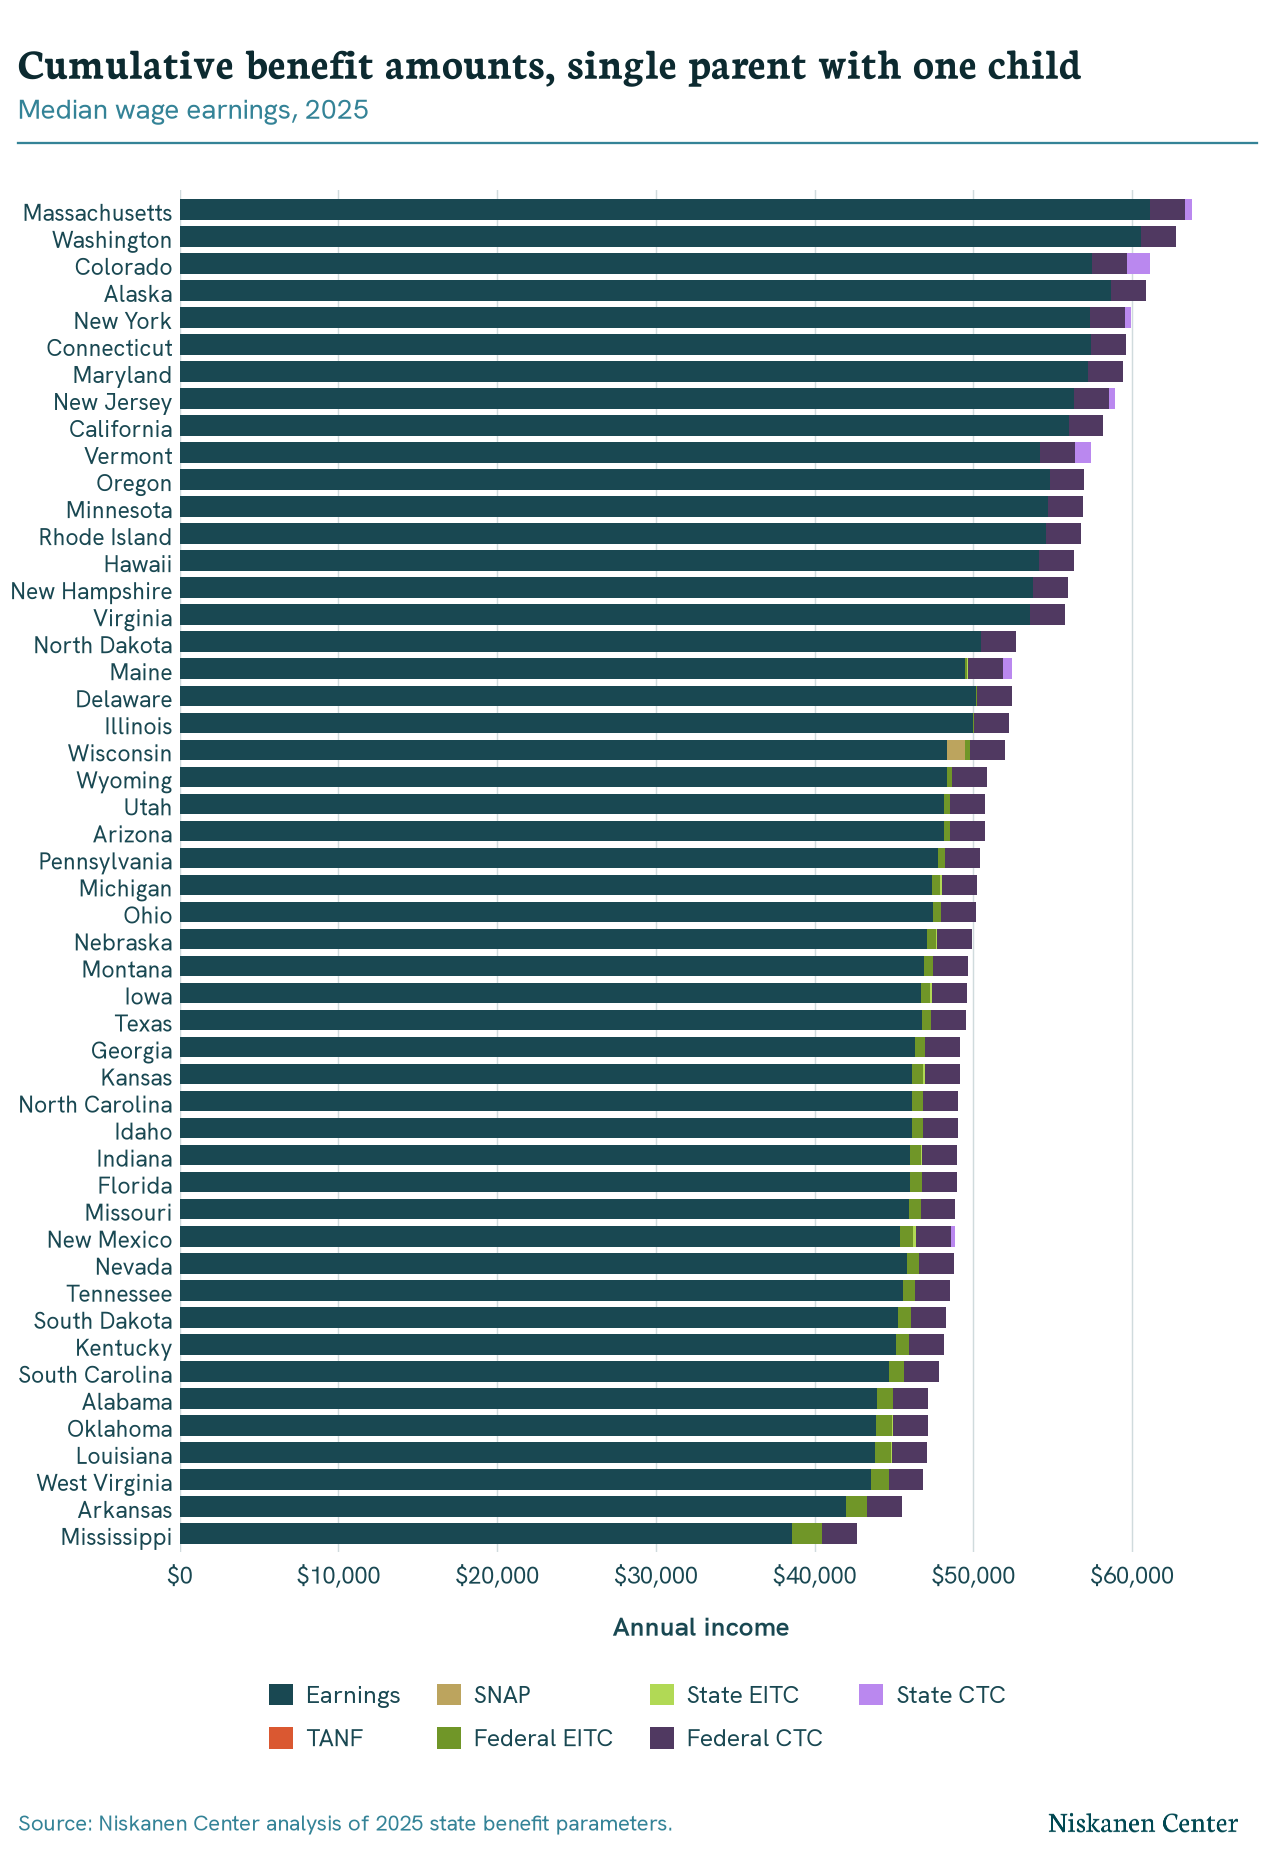
Figure 6: Income breakdown for married parents with two children, median wage earnings
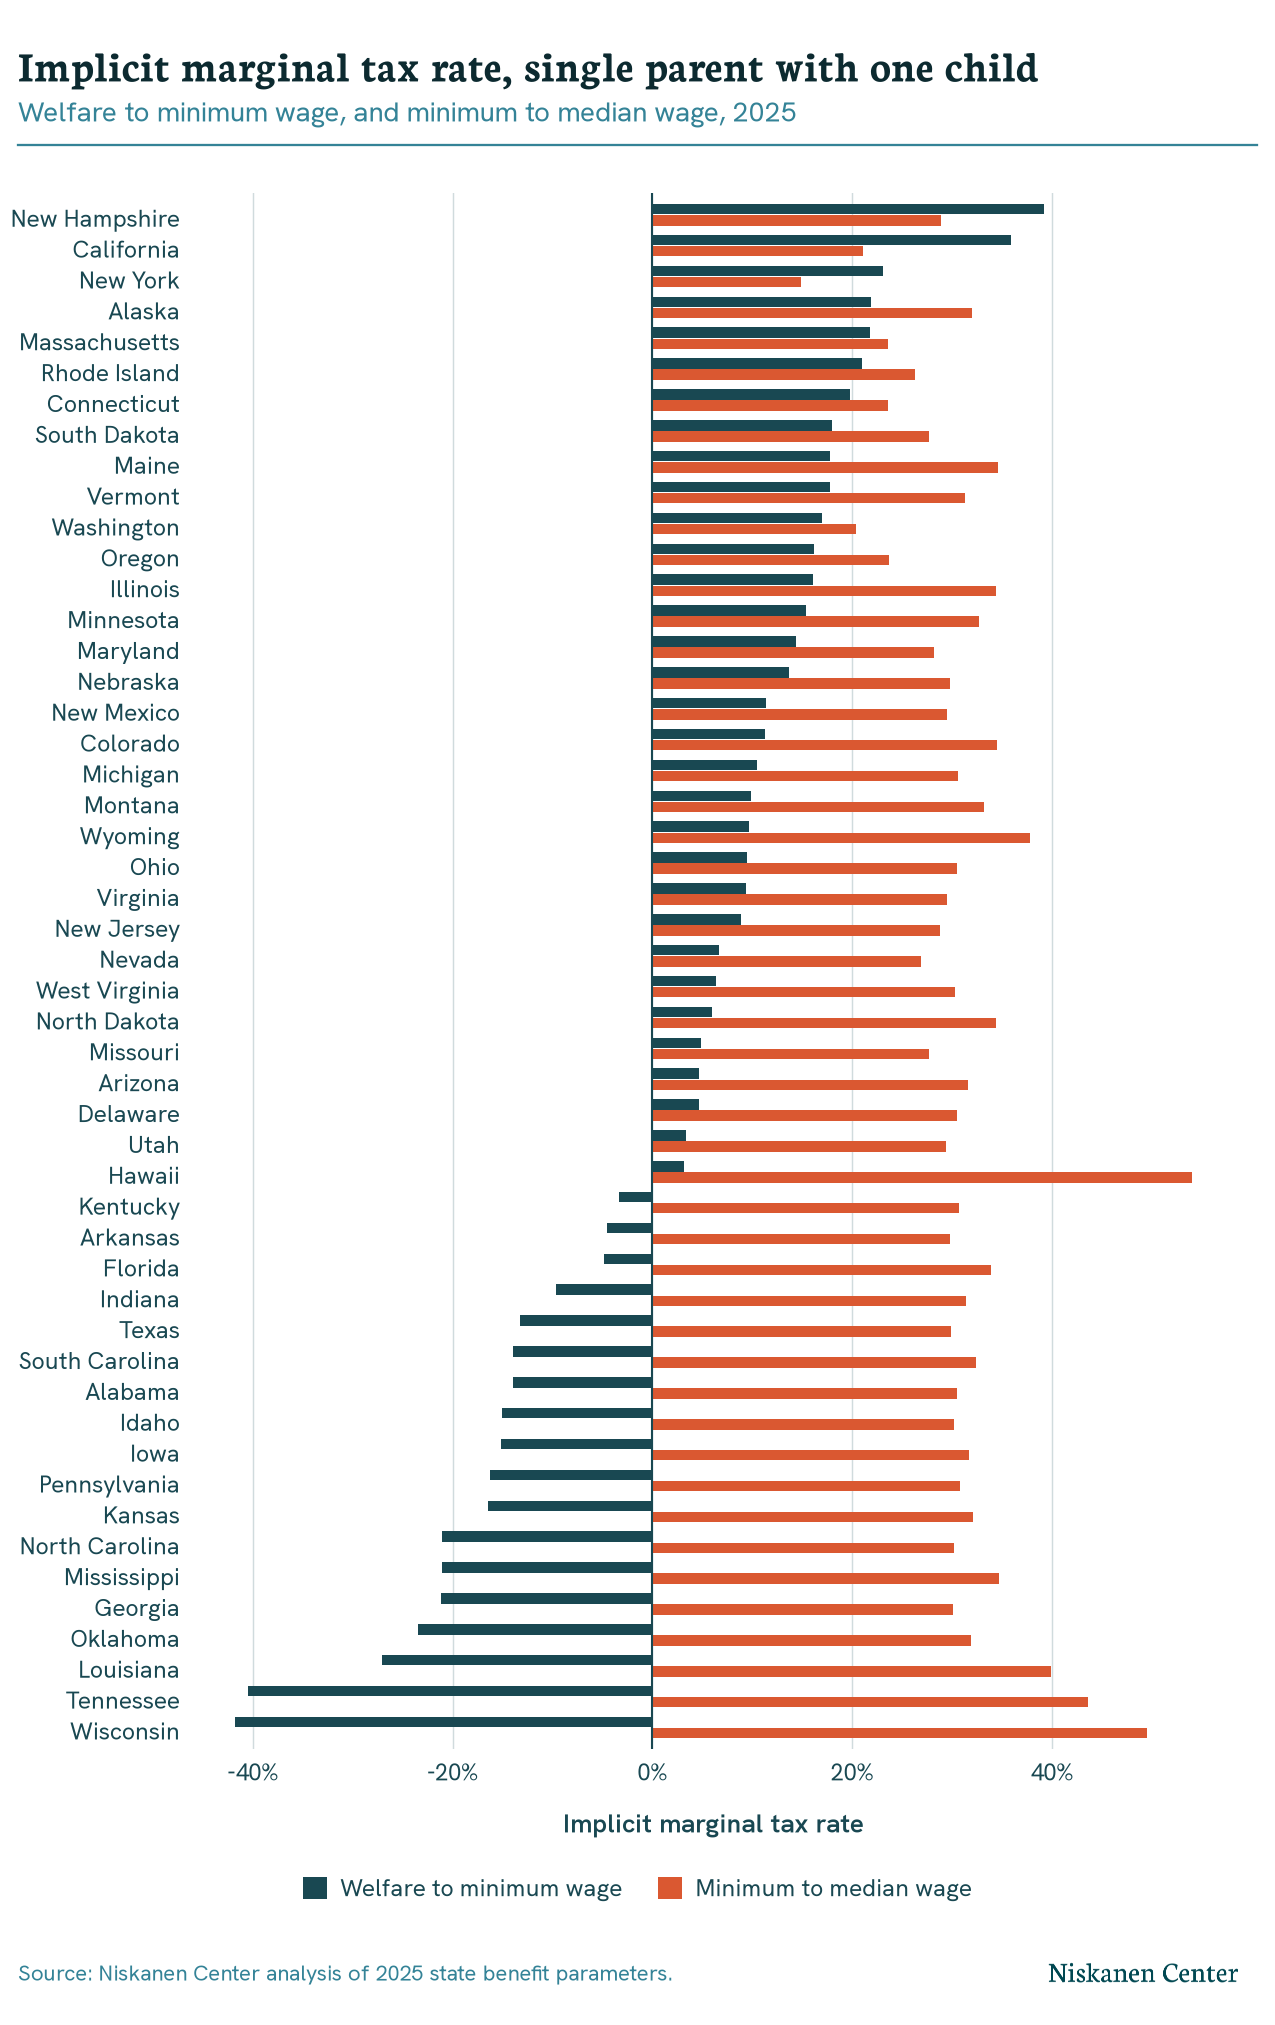
Family incomes are not static over time. Parents get jobs and earn raises and promotions, so we want to understand what happens to their benefits when their earnings increase. Looking at what happens when families move from welfare to work and from minimum-wage to median-wage jobs provides a better understanding of the implicit marginal tax rates they face when they climb the economic ladder. Here’s what the data shows:
A single parent who has one child and moves from welfare to work faces IMTRs ranging from -42 percent in Wisconsin to 39 percent in New Hampshire. When that same family climbs the ladder from a full-time minimum-wage job to a median-wage job, it faces IMTRs ranging from 15 percent in New York to 54 percent in Hawaii.
Figure 7: Implicit marginal tax rates, single parent with one children
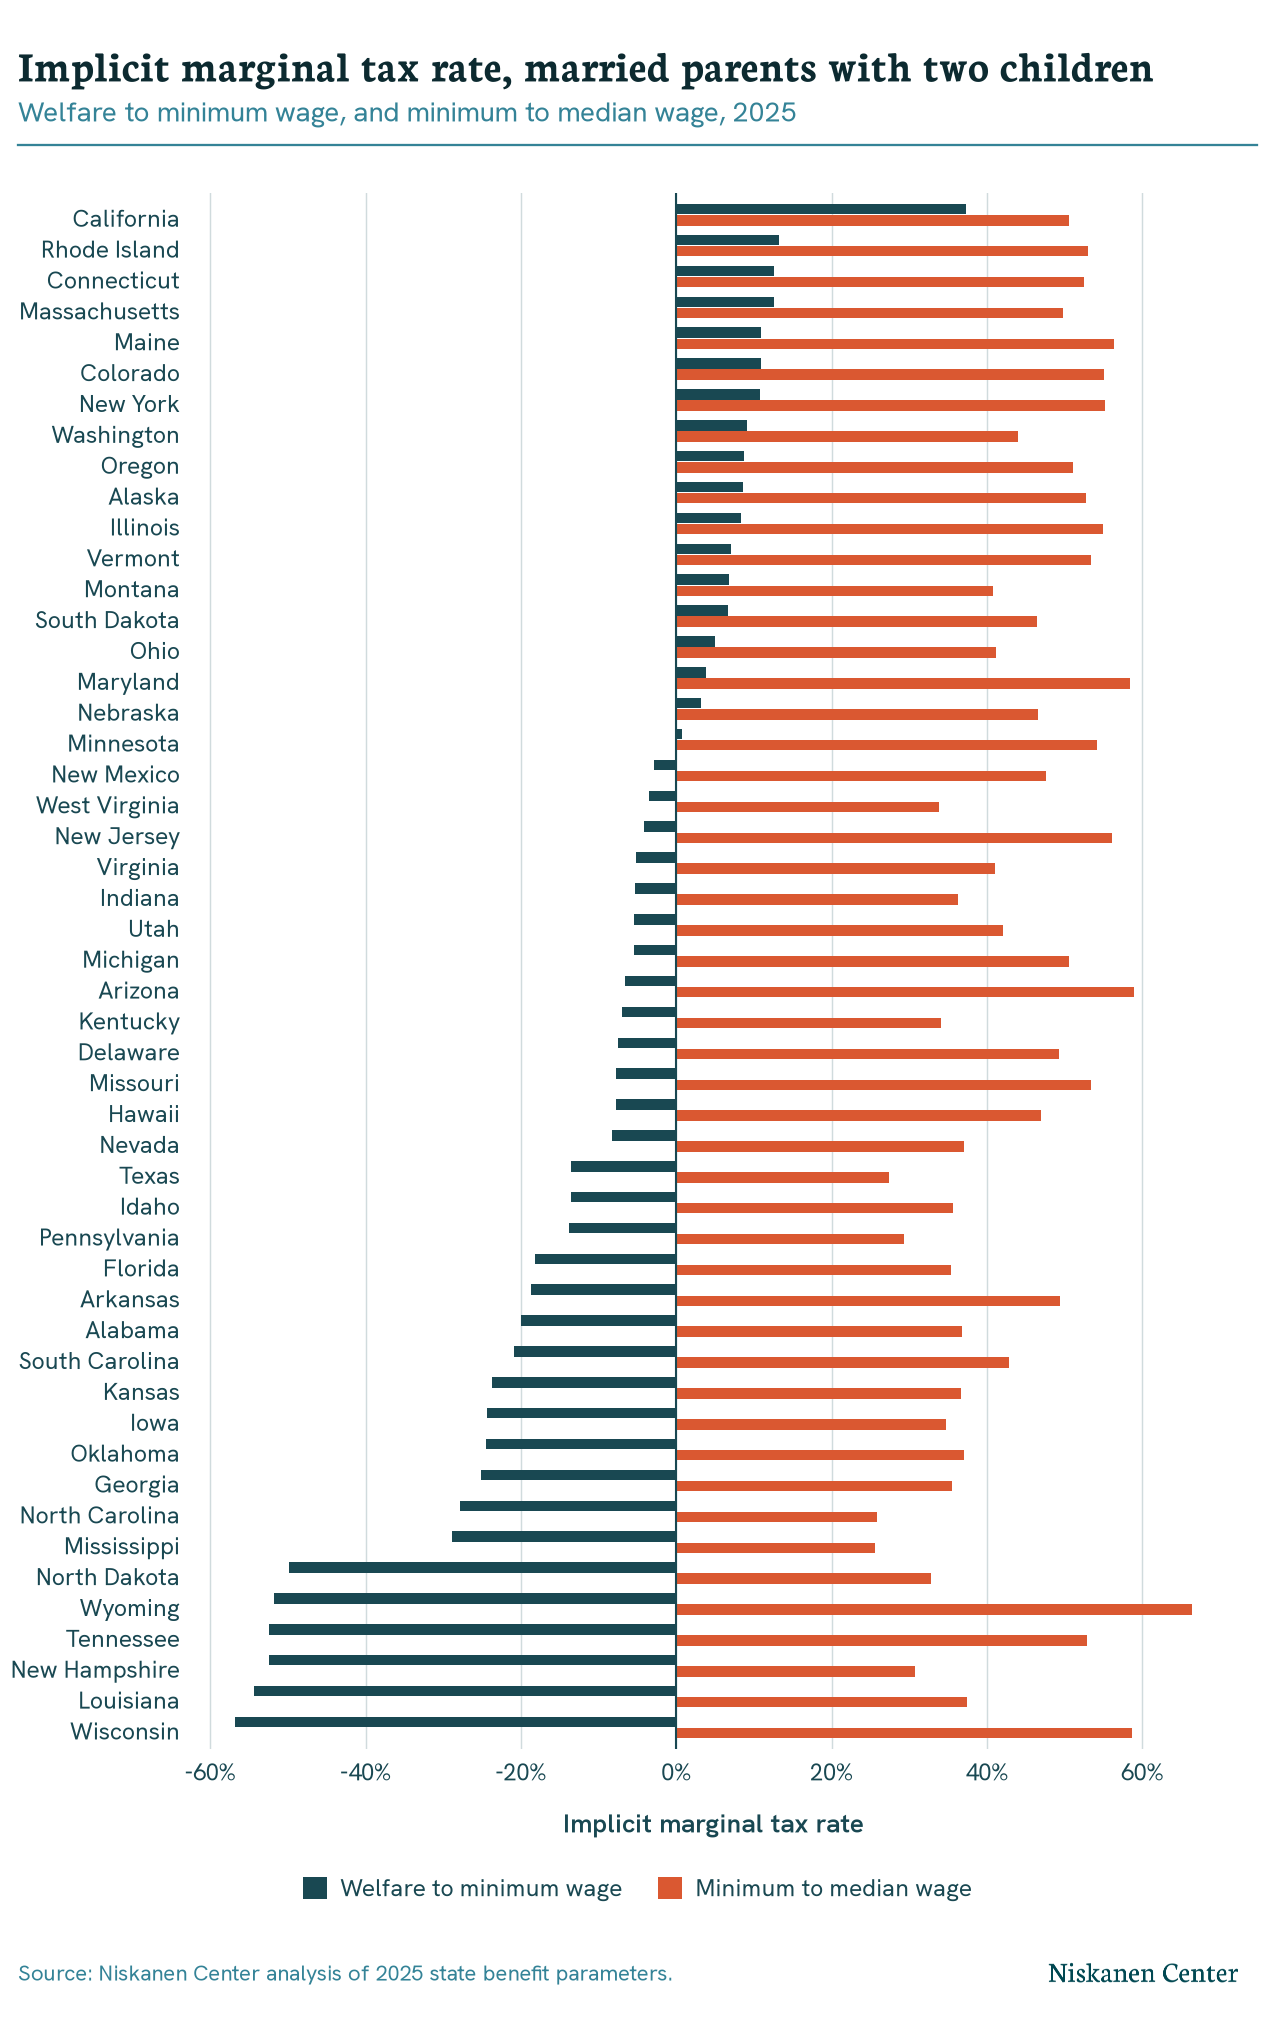
A married couple that has two children and moves from welfare to work faces IMTRs ranging from -57 percent in Wisconsin to 37 percent in California. When that same family climbs the ladder from a full-time minimum-wage job to a median-wage job, it faces IMTRs ranging from 26 percent in Mississippi to 66 percent in Wyoming.
Figure 8: Implicit marginal tax rates, married parents with two children