The U.S. electricity grid is divided into many regions, with sometimes limited capacity to transfer power back and forth. Advocates and regulators generally agree that interregional transfer capacity can help stabilize the grid during extreme weather events or unexpected plant outages. In such situations, one region that needs power could get it from a neighboring region with excess capacity. Decision-makers at the Federal Energy Regulatory Commission (FERC) and National Association of Regulatory Utility Commissioners (NARUC) are debating whether to pursue some required interregional transmission capacity. Still, the discussion lacks any foundational data on what capacity exists, let alone what the desired levels should be.
The Niskanen Center asked Greg Schively at Carbon Impact Consulting to help quantify how much interregional transfer capacity exists and to provide a basis for moving the discussion forward towards specifics. The data isn’t readily available, making this task challenging. What is available has different definitions and applicability; even defining each region is fraught.
We started with FERC Order 1000 planning regions, i.e., the self-assigned groupings of utilities for planning purposes per FERC Order 1000 requirements, and the Electricity Reliability Organization of Texas (ERCOT). Though ERCOT is not subject to Order 1000 planning requirements, it is still subject to some FERC reliability oversight and has struggled in the face of extreme weather in recent years. However, FERC does not provide public data on transmission within or between regions, so we needed another data source.
Next, we tried matching the regions from EPA’s Integrated Planning Model (IPM – a source of transmission data) with these regions. For simplicity, the matching folds the South Carolina Regional Transmission Planning Region into the Southeast Regional Transmission Planning Region. The shift from IPM regions to FERC regions illustrated in Figure 1.
The differences in the two maps show that the matching process struggled in Montana and North Dakota, where three planning regions have complex and interwoven borders. One of those regions, Midcontinent Independent System Operator (MISO), provides further complications due to its odd border with PJM to the east and its hourglass shape. The region is often referred to as MISO-North and MISO-South (even though they technically are one planning region).
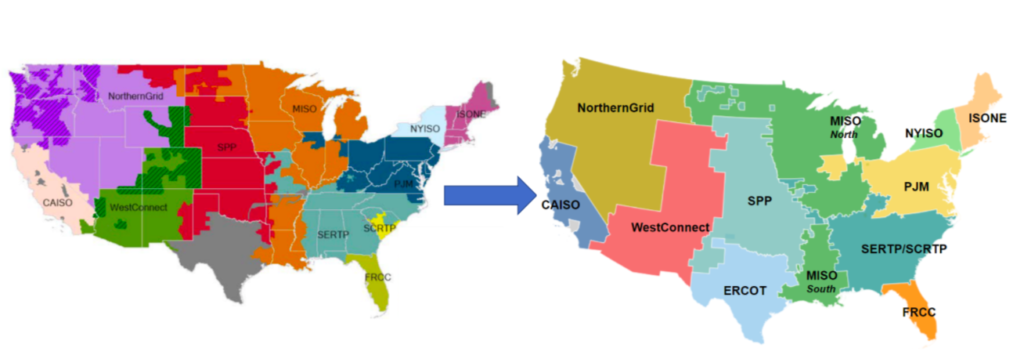
Figure 1. FERC Order 1000 Planning regions (left) and approximations from aggregating EPA IPM regions (right)
We estimated the gigawatts (GW) of transfer capacity based on the firm capacity in the EPA model and manually adjusted it to correctly account for the geographic location of back-to-back HVDC stations at the Eastern and Western interconnection seam. In the map in Figure 2, these GW connections are converted to percentages of the peak load for the region with the larger peak, based on the NERC 2022 Summer Reliability Assessment and supplemented with historical hourly demand data from the Energy Information Agency (EIA).
We compared the transmission capacity numbers to the EIA’s hourly interchange data to check the results. In some cases, the EIA data indicates the amount of power transferred has never reached as high as the EPA IPM values. However, the interchange data was also inconsistent, e.g., in some instances, PJM and MISO reported different values exchanged for the same periods, so we did not change any values to reflect EIA data.
Overall, our analysis indicates certain regions have dangerously low levels of interregional transfer capacity (red arrows in Figure 2), leaving them vulnerable to local or regional weather events. The choice of 15 percent of peak load as a target level is based on reviewing comments to FERC and considering European approaches to grid integration. Notably, ERCOT has the lowest transfer capacity and has recently experienced both winter and summer grid strain. MISO South, SPP, and FRCC are also perilously isolated. MISO North accounts for most of the region’s transfer capacity, giving MISO South a free rider benefit if Order 1000 regions are used for this definition. Even with our possibly generous numbers, only one interregional border has a transfer capacity greater than 15 percent of peak load: NorthernGrid to WestConnect (green arrow in Figure 2).
Lack of transfer capacity leaves some regions more vulnerable
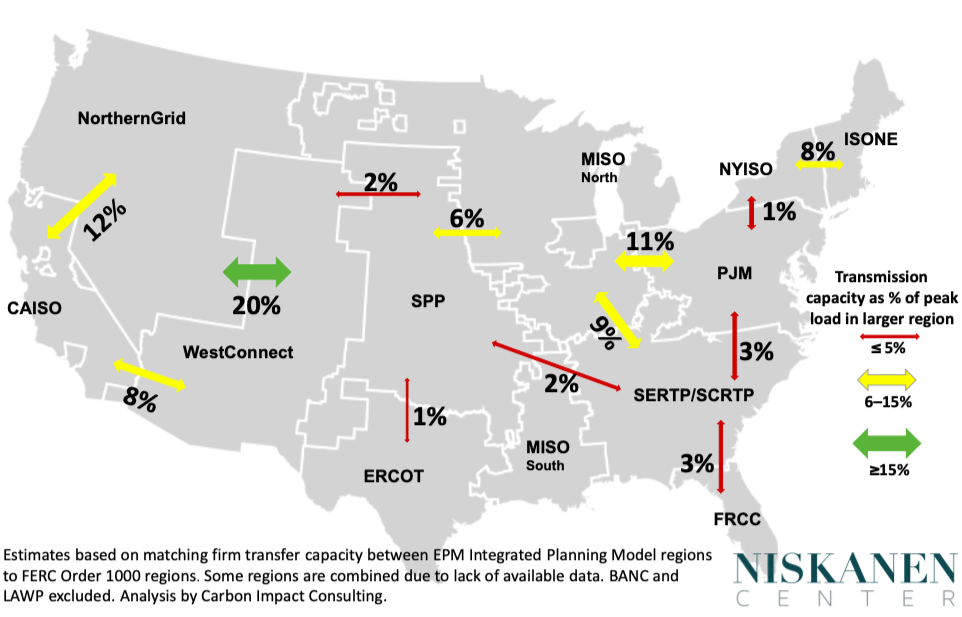
Figure 2. Based on the EPA Integrated Planning Model, the analysis of existing electricity transmission transfer capacity between adjacent FERC Order 1000 planning regions. Percent [%] reflects the interconnection capacity of connected regions as a percentage of the peak load of the larger region. Arrow colors indicate levels, red ≤ 5%, yellow 6-14%, green ≥ 15%
In July’s task force meeting, Chairman Glick reflected on the Texas power outage caused by winter storm Uri and how increased transmission capacity can provide resilience benefits (that is, if ERCOT had more capacity to bring in power from other regions, it could have kept the lights on). The task force discussed minimum transfer at a theoretical level, agreeing it is important but must be considered carefully, and each region should be treated differently depending on its needs.
The FERC and NARUC commissioners agreed further study of the best approach to establishing interregional transfer capacity goals is needed. Though our initial search for concrete numbers shows that further study is warranted to define regions and transfer capacity, it also indicates an urgent need for action to start moving towards a more connected and resilient grid. The process the FERC and NARUC task force members suggested sounds more like analysis paralysis than decisive action to get interregional transmission built. Clear direction from Congress may be necessary for the discussion to come to a timely conclusion that results in a more resilient grid.