
I have a piece up at RealClearDefense responding to a recent essay in the National Interest by Heritage Foundation defense analyst Justin Johnson. The Cato Institute’s Christopher Preble and William Hartung of the Center for International Policy have also responded to Johnson here and here. Why has this piece garnered multiple responses? In his essay, “5 Bad Arguments for Cutting U.S. Defense Spending,” Johnson wants to take down what he considers poor reasons advocates of lower defense spending often bring to the table. While all the arguments he seeks to rebut are up for debate, Johnson’s responses do not pass muster.
Johnson’s essay was a distillation of a report he wrote for Heritage last year. The report is in some ways better than the essay. In at least one way it is far worse.
Johnson offers far more detail in the report than he does in his National Interest essay. Obviously a publication’s word limit makes it difficult for any author to provide as much detail as they would like. However, the detail Johnson supplies highlights at least one of the contradictions I note in his essay. For example, in my response to Johnson, two of the problems I identify with his rebuttals deal with his dismissal of comparisons between U.S. defense spending and the combined spending of other countries and what he refers to as “inventory counts” of U.S. aircraft carriers. I argue that, while not determinative, that the United States spends twice as much as its potential adversaries combined, and has as many aircraft carriers as the rest of the world combined, tells us something about the relative military capabilities of the United States and countries with whom it might engage in hostilities. In his essay, Johnson dismisses such comparisons to potential adversaries but then oddly compares U.S. defense spending to overall government spending and the size of the economy and the size of the U.S. Navy and Army today to each service’s size on the even of World Wars I and II, respectively. Johnson similarly dismisses spending comparisons and “inventory counts” in his longer report but then cites growth in Chinese military spending and a similar inventory count of growth in China’s People’s Liberation Army Navy in rebuttal to the point that America has more aircraft carriers. He is no way out of line to provide these figures. In fact, I would argue these comparisons are entirely appropriate—even though such quantitative comparisons do not take into account American qualitative advantages. But it is odd that he does so after saying that America’s relative quantitative advantages in spending and aircraft carriers are irrelevant.
Other parts of Johnson’s report do offer sensible observations. For instance, he rightly notes the pressure increased personnel costs have put on the Pentagon’s acquisition budget. Furthermore, he offers a sound explanation for why targeting “waste, fraud, and abuse” might not produce the type of savings those who wish to reduce defense spending might imagine. These are real problems and reasonable people can and will disagree on the solutions to them.
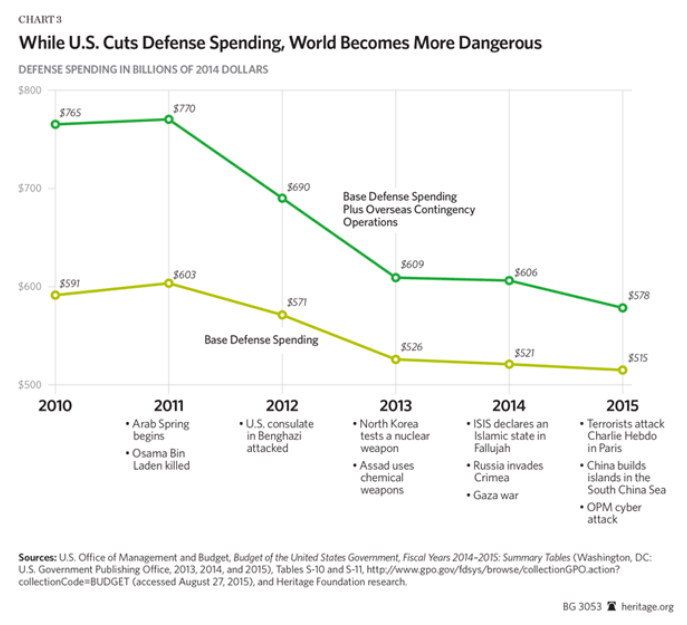
Those reasonable disagreements are why debates over the defense budget are important. But there are ways to legitimately debate these issues and ways not to. And that brings me to where Johnson’s report is far worse than his National Interest essay. This chart is an example of how not to debate defense spending:
I cannot say this is the worst chart in the history of charts only because I have not yet seen every chart ever made. That said, this is a bad chart. At best it says absolutely nothing at all. At worst it implies a non-existent correlation between the defense budget and the events listed below. Listing what are arguably “positive” events—the Arab Spring and the death of Osama bin Laden—underneath the peak year of defense spending in the chart, followed by lists of increasing numbers of “negative” events as defense spending decreases, clearly suggests a relationship between the level of defense defense spending and these events.
Assuming that the relationship is being implied, there is a testable hypothesis here. Maybe decreasing defense spending does cause, or at least correlate with, all sort of bad things happening in the world. Let’s see if similar events to those Johnson cites when defense spending was decreasing occurred when the defense budget went up. History did not begin in 2011, after all.
In 2013, as Johnson notes, while the defense spending continued to decline, North Korea tested a nuclear weapon and the Assad regime in Syria used chemical weapons. These are both bad things, certainly. But in 2006, when Department of Defense budget authority was 62 percent higher than it was at the nadir of the post-Cold War drawdown—and 4 percent higher than at the peak of the Reagan defense build-up—North Korea tested a nuclear weapon and Al Qaeda in Iraq blew up the Al-Askari Mosque, escalating sectarian violence in the country even further. That same year, Israel and Hezbollah went to war with one another. There are probably other negative events in 2006 that increased defense spending did nothing to prevent, but let’s look at another year. In 2014, Johnson lists the Islamic State’s declaration of a caliphate, the Russian invasion of Crimea, and the Israeli-Hamas conflict in Gaza. But if we look at 2008, when Pentagon budget authority had increased 18 percent over 2006, Russia invaded Georgia and a conflict began between Israel and Hamas in Gaza. North Korea also detonated a nuclear weapon in 2009 when Department of Defense budget authority was 15 percent higher than it had been in 2006. And while it is true that the attack on the U.S. consulate in Benghazi took place in 2012, the 7/7 attacks in London took place in 2005 when the defense budget was 33 percent higher than it had been on 9/11.
But what about positive events? Johnson’s chart clearly shows that good things—like democratic movements in the Arab world and the death of terrorist masterminds—occur when the defense budget peaks. Do good things ever happen when the defense budget decreases? Well, from the peak of the Reagan buildup in 1985 to 1991, defense budget authority fell 20 percent. During that same period, Moscow agreed to give up its intermediate-range nuclear weapons in Europe, the Berlin Wall fell, the U.S. military destroyed Iraqi forces in Operation Desert Storm, and the Soviet Union collapsed.
Did all these events take place because the defense budget decreased? Probably not. Attributing events that are loosely connected—or, in some cases, not connected at all—to variations in defense spending would be just as silly as noticing that there is a correlation between the number of Nicholas Cage movies released each year and the number of deaths by drowning in a pool that same year, and attributing those deaths to the Oscar winner (see here).
Johnson may argue that he is not trying to imply either correlation or causation with his chart, but instead that he is simply trying to provide examples of dangerous events that are occurring as the defense budget reduces. I would not buy that argument given the far greater amount of data available, and far more rigorous analysis, showing that the world is a safer place. But I could be willing to accept it were it given. Instead, Johnson makes only a cursory attempt to do so—leaving his readers to deduce the chart’s implications. Given that it lists two positive events occurring as defense spending peaked and an increasing number of negative events as defense spending reduces, what the author is implying seems clear. However, doing so should be lesson one in a master class on how not to argue about the defense budget.