Key Takeaways
- The Denver region built a rail transit system but struggles to attract riders due to tradeoffs made in its planning and construction to prioritize speedy project delivery over ridership potential.
- Colorado’s recently enacted Transit Oriented Communities (TOC) law encourages communities to upzone land around transit infrastructure to boost the state’s housing supply and grow transit ridership.
- The law is likely to drive substantial housing growth that will complement the Denver region’s existing transit infrastructure, but to be most effective the state should better support communities that facilitate this growth.
The Denver region has a strong economy, good weather, and natural splendor. It has attracted double-digit population growth every decade since at least 1900. But its housing supply has not kept up with rising demand, and correspondingly rising prices mean the area is increasingly inaccessible to many people who want to live there. In the past five years, home prices have jumped to almost six times the region’s average household income, making it the 12th most expensive region in the country.1
At the same time the region’s rail transit system, an important tool to connect people with opportunity, is short on riders. In 2004, voters approved a plan to build a new rail transit system for the Denver Area under the FasTracks initiative, a multibillion-dollar transit expansion to improve mobility across the Denver area. To drive public support for FasTracks, policymakers pledged to build it quickly. As part of this strategy, the system was painstakingly designed to bypass neighborhoods whose opposition would have added legal delays and costs. That meant, it was designed to follow easily acquired land for rights of way including along railroads and highways. But it was a decision that would hobble the system’s ability to fulfill its promise: Because these areas do not have existing population numbers to support transit service, the Regional Transportation District’s (RTD) rail transit system struggles to reach its ridership potential.2
Colorado is taking an innovative approach to addressing both the region’s housing and transit challenges with one piece of legislation: In 2024, the state enacted the Transit Oriented Communities (TOC) law to help grow housing production near transit in the state with the assumption that increased housing supply near transit will also increase transit ridership.3
Starting in 2027, the law requires communities with qualifying transit service located within one of the state’s five Metropolitan Planning Organizations to upzone land near certain transit stations and bus routes to allow higher density development, and to adopt reforms to speed permitting approvals for housing development.
If successful, the law will increase development near existing transit stops in ways that increase housing supply and support the region’s transit system by boosting ridership across the network. The state can help ensure the law’s success by providing additional support to communities to finance the up-front costs associated with accommodating growth, including schools, infrastructure, and public safety personnel.
How will the new TOC law alter neighborhoods near rail transit stations, and how much additional ridership can the system expect over the course of its planned 40-year buildout? To answer these questions, this report explores three scenarios based on how much new housing is actually built following the upzonings.
The report further examines the relationship between existing land use conditions and zoned capacity targets under the TOC law, assuming no parcels are excluded beyond the constraints established by the 0.5 mile walksheds, or the area around a destination easily reachable on foot in a reasonable amount of time.4 It will examine whether these targets are sufficient, effectively targeted, or generally adequate after applying a correction factor to reduce zoned capacity to reflect probable buildout after a reasonable period of time. It will then assess whether the projected population gain can support rail transit service of the kind offered by the RTD. Finally, it recommends ways the state could support upzonings near transit and communities as they accommodate growth.
Transit-oriented development laws in Colorado and elsewhere
Colorado is not the first state to incentivize denser residential development near transit through state law. Four others — Massachusetts, Washington, California, and Maryland — have all enacted density-boosting laws over the past decade, with varying approaches and levels of success.5
In Massachusetts, the Massachusetts Bay Transit Authority (MBTA) Communities law is the most similar to Colorado’s FasTrack. Enacted in 2021, the law requires communities served by the state’s largest transit agency to establish at least one zone in which multifamily housing is allowed by right, or else lose eligibility for certain state grants. Covered localities must allow for a 15-unit per-acre minimum density across a reasonably sized district near a subway station, commuter rail station, ferry terminal, major MBTA bus station, or other transit asset specified in the law.
So far, the Massachusetts approach has accounted for 7,000 newly permitted housing units.6 The law provides communities with abundant flexibility on how to satisfy the policy’s goals — maybe too much flexibility, as more than twice as many permitted projects are more than half a mile from the region’s commuter rail stations, farther than most people expect to walk to catch the train.7
Colorado’s approach
Under Colorado’s approach, the state sets broad goals using a uniform method to calculate the community’s housing opportunity goal, while allowing localities discretion on how to meet their goals in ways that reflect local conditions and cultures. A community’s housing opportunity goal is the amount of housing it is expected to provide under the law. It is based on a formula in which buildable land area near transit stations and frequent bus lines is multiplied by 40 units per acre. This number produces a total “zoned capacity” for each locality that can be targeted around transit stations and bus lines. It’s higher than the density target in the Massachusetts law and more likely that existing sites can be economically redeveloped.8
Calculating a community’s housing opportunity goal Under Colorado’s Transit Oriented Communities law
First, sum all land within 0.5 miles of a rail transit or bus rapid transit station as well as all land within 0.25 miles of a frequent bus route.
Then subtract unbuildable parcels including: parks, natural areas, government buildings, cemeteries, airports, conservation easements, areas vulnerable to natural hazards like floodplains, and other areas difficult to develop due to practical limitations.
The community’s housing opportunity goal is equal to that acreage multiplied by 40 units per acre. This is the number of units that must be accommodated under the zoning rules in one or more self-designated transit centers.
“Zoned capacity” is the theoretical maximum development of an area under zoning regulations, but in reality it is never fully built out on as wide a scale as an entire city or region. Even in the most housing-constrained markets, buildout much beyond 50 percent of zoned capacity is rare. Perhaps the best historical example of the relationship between zoned capacity and population growth is a 1959 report from the New York City Planning Commission that proposed a downzoning from the city’s 1916 zoning code. Under the 1916 code, the city had a zoned capacity sufficient to accommodate roughly 55 million people. By 1957, the city’s population had reached 7.8 million, or just 14.2 percent of its zoned capacity.9
The Colorado TOC law requires qualifying communities to meet their housing opportunity goal by upzoning in areas within 0.5 miles of rail transit and Denver Bus Rapid Transit (BRT) stations, and within 0.25 miles of qualifying bus corridors. Communities are not required to upzone every parcel in these areas, but they face a tradeoff between zoning fewer parcels to a higher density or upzoning broadly to a lower overall density to achieve the same number of total possible units.
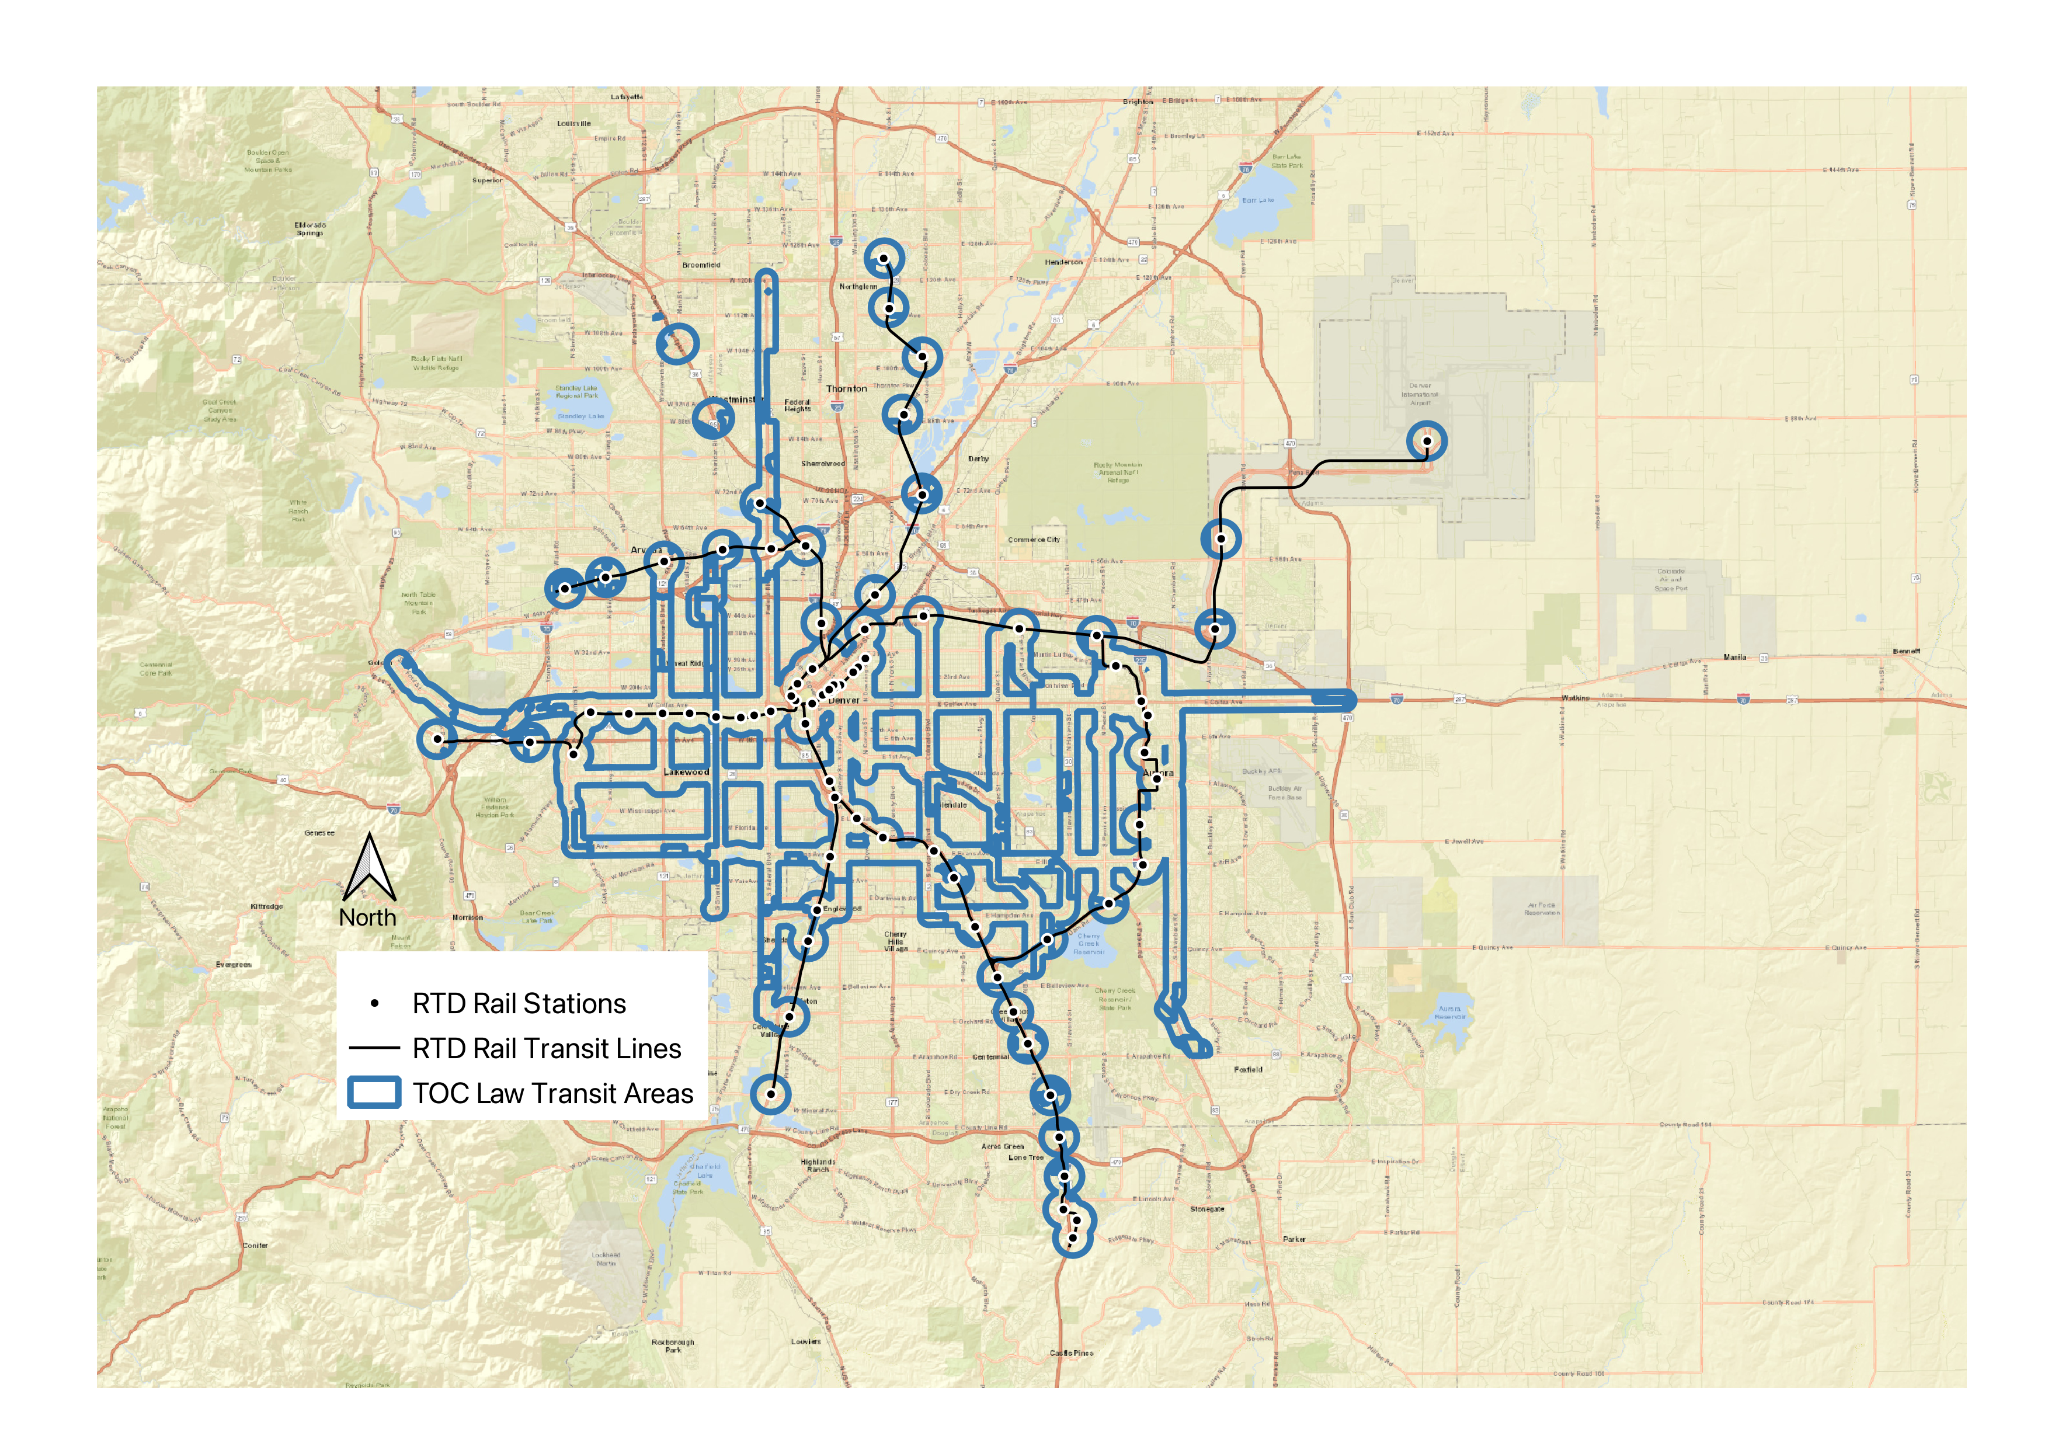
In Figure 1, eligible transit areas are represented as blue outlines around rail or BRT stations and along frequent bus lines. Combined with the underlying street and highway map, the general extent of the transit system and transit areas compared with the region as a whole is visible.
Fig. 1: Combined transit areas from both rail and bus services in the Denver metro region
Transit areas under the TOC law can include either parcels within 0.5 miles of a rail transit or Bus Rapid Transit station, or parcels within 0.25 miles of a frequent bus corridor.
From this basic framework, the Colorado TOC law offers several exemptions for calculating the housing opportunity goal. Exemptions include parcels in environmentally sensitive areas; floodplains; parks and cemeteries; agricultural and forestry uses; and areas where foot traffic is restricted. Parcels or parts of parcels in these categories don’t count toward the community’s total housing opportunity goal, but it is up to each community to determine which land is within these exempted areas and adjust their housing opportunity goal accordingly.
The TOC law allows some flexibility in siting transit-oriented development beyond the most immediate areas near transit stops or bus lines. The law allows some transit center upzonings to take place on parcels up to 0.75 miles from rail or BRT stations and up to 0.5 miles from frequent bus lines, or a 0.25 mile extension beyond the transit areas used to calculate the housing opportunity goals. Policymakers may view this extension as a way to grant flexibility to local decisionmakers, but the consequence is that new residents will live farther from high-quality transit than they otherwise would, and so they may be less likely to use it if new housing is built outside walking distance from transit stations.10
For this study, we assume all transit center upzoning will occur uniformly across the 0.5-mile effective walksheds near existing rail stations. While the law allows it, no upzoning is assumed around qualifying bus routes. This will ensure the greatest share of residents in the upzoned areas will have access to the rail system, which is also the infrastructure with the most capacity to accommodate ridership growth.11
Transit center parcels designated for upzoning must be zoned for at least 15 units per acre. This is done to avoid “pinpoint zoning” that would upzone relatively few parcels to a high maximum density while leaving the rest of the transit area at an artificially low density. Without this provision, it is possible that communities that didn’t want housing growth could still satisfy the letter of the law by upzoning parcels on which building would be unlikely or impractical, as has happened elsewhere: In Massachusetts, the coastal community of Marblehead upzoned an existing golf course for new housing knowing that it was unlikely to be converted.
Transit station walksheds
Effective walkshed areas — that is, the area around a destination that’s easily reachable on foot in a reasonable amount of time — is crucial. Walkshed areas for all transit stations are based on surface streets and pedestrian paths that a pedestrian would encounter within a 0.5-mile walk along existing rights of way from each transit station.
Some rights of way classifications are excluded, like limited access highways where the law excludes pedestrian access. Others, such as informal cut-throughs of private property, are also excluded.
Walkshed simulations continue in each direction until the 0.5-mile walking limit is exhausted, showing the black outlined shape in Figure 2 below. This approach provides a more realistic way to establish land suitable for transit-supportive densities by removing land that is not easily reachable via public rights of way.
As illustrated in Figure 2, an area with an efficient street grid will allow a larger effective walkshed. Areas with indirect and disconnected streets provide the smaller effective walksheds. Major infrastructure, including grade-separated highways and railroads, can form a wall that walkers cannot penetrate, cutting off otherwise walkable areas from a station.
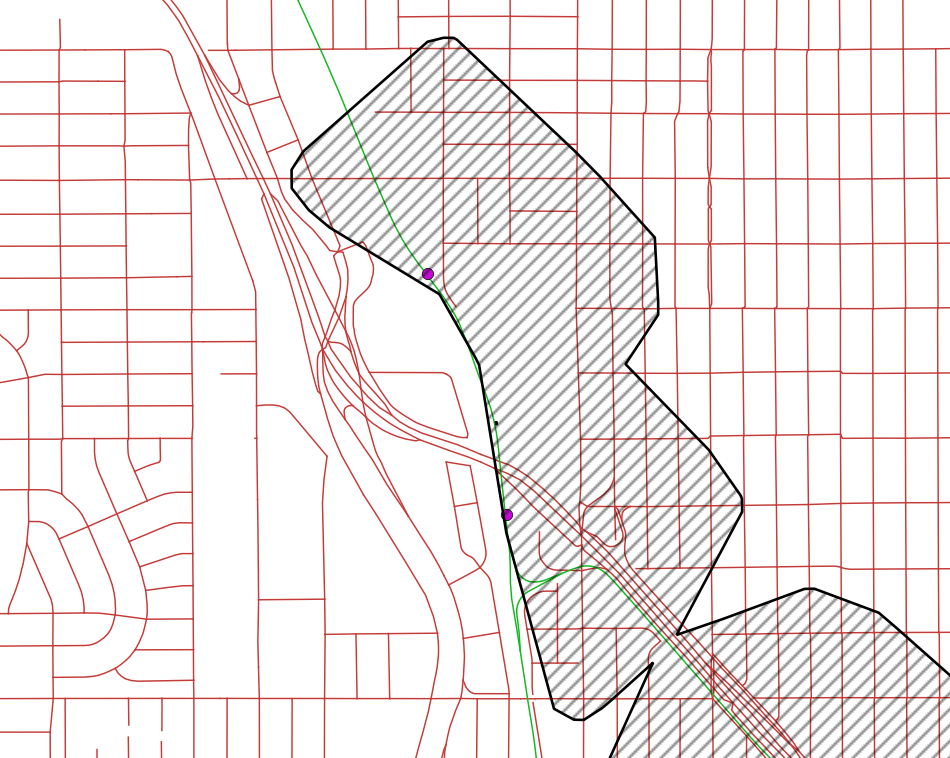
Fig. 2: Sample walkshed calculation where the crosshatched area represents land a pedestrian could access within 0.5 miles of the nearest transit station, shown in violet, by following public rights of way. Surface streets and highways are shown in red while rail lines are green.
Under the TOC law, cities must also reform their permitting procedures. Rezoned areas must ensure that zoned capacity reflects all other requirements that influence buildout (e.g., parking and open-space minimums); must not restrict housing occupancy based on age or other factors; and must use an administrative rather than a discretionary approval process for multifamily development on parcels smaller than five acres.12
Carrots and sticks
The law leaves cities latitude as to how they hit these targets, so it strikes a compromise between the state’s strategic targets and a modicum of local control on reaching the law’s housing opportunity goals.
In return for allowing residential density that complements the region’s existing transit network, cities are eligible for additional state infrastructure funding. Even though an expanding tax base from a growing population should support local services and infrastructure, communities’ tax receipts during their growth phase may lag the need for additional infrastructure and services as a result of the new development.
For that reason, Colorado established a one-time $35 million infrastructure fund and is providing a new affordable-housing tax credit for projects near transit stations.13 The law authorizes the state housing finance authority to allocate $30 million of tax credits to qualifying projects through Colorado’s fiscal year 2029, with most of the credits to be awarded in 2028 and 2029.
If a city does not meet zoned capacity targets, the state will withhold the city’s share of state highway funding. After 180 days of noncompliance, the state will distribute the city’s local highway funds among the other communities covered by the TOC law. One challenge facing state and local decision-makers — a lawsuit filed by six communities contesting the state’s authority to preempt local land use rules that otherwise restrict density — could derail the policy. Almost all of the six cities are in the Denver metro area, and many are served by RTD rail transit lines, although Denver itself is not one of them.14
The Regional Transportation District and the modern transit system
Denver had no light rail or commuter rail operations when the state legislature created the Regional Transportation District (RTD) in 1969. The current rail transit offerings had to be developed from scratch. Voters approved a referendum in 2004 to build a new rail transit system under the RTD’s FasTracks program. The plan established a multibillion-dollar transit expansion plan that included new light rail and commuter rail lines, expanded bus service, and established additional transit hubs in the region.15 This program aimed to transform Denver’s transportation landscape, providing alternatives to automobile trips and supporting transit-oriented development around the region.
In an effort to deliver service quickly and avoid potential opposition, planners chose to route FasTracks program’s rail transit lines through places where rights of way were easily accessible, including existing railroad lands and highway medians. In many cases, RTD rail transit lines avoid some of the most densely populated neighborhoods in the region. This choice means stations are often in industrial areas, near highways, or otherwise away from where people live, making it difficult for many residents to ride the system without substantial new development near the stations.
In addition to these route-planning decisions, planners provided substantial amounts of surface parking near stations for park-and-ride commuters, further reducing population densities within walking distance of the transit system.16
As a result, the RTD rail transit system, funded mostly by the FasTracks referendum, has underperformed relative to its size and cost. The light rail side of the system averages 638 boardings per mile every weekday, trailing many smaller cities and even the recently closed Washington, D.C., Streetcar, a tiny local line that ran between eight stops along a 2.2-mile corridor just outside the city center.17 On the commuter rail lines, the system sees 518 riders per mile on weekdays, among the best rates in the country. But this may have more to do with frequencies of 30 minutes or better throughout the day on these lines and their direct connection to Denver International Airport.18 Neither the all-day service pattern nor direct airport connection are common for commuter rail operations in the U.S.
Population density and transit
Most people understand that residential density and good transit support each other, but the mechanics of this relationship are rarely explored. We measured population density around the Denver region, including near RTD rail transit stations to show the relationship between existing RTD rail transit service and where the greatest concentrations of people live in the region. It also helps quantify how many people currently live within a 0.5 mile walk of a rail transit station, and how many might live in those places after the TOC law is fully implemented.
As a general rule, increased population densities near transit stations will improve ridership on those services. Furthermore, different service types will require different levels of ridership to offset their level of capital and operating costs. More intense service types, such as heavy metros19 or traditional subway rapid transit services, require the greatest amount of ridership to offset their costs, while less intense services such as buses require fewer riders to offset their lower costs. Researchers have translated this need for ridership based on service type into benchmarks for station-area population densities to help guide decision-makers when determining appropriate transit services for an area or how to zone land near existing transit.
Under this framework, ordinary fixed-route bus service20 becomes viable at around 3,000 people per square mile. This is a level commonly found in many American communities, including central cities and their older suburbs. Many modern suburbs also exceed this density, but their land-use patterns and street networks can make walking to and from bus stops more challenging, limiting the walksheds around bus stops and shrinking the practical base of riders.21
Densities around 10,000 people per square mile see transit usefulness and ridership rise significantly. At this density, bus service with frequencies better than every 15 minutes or services with speed-boosting features such as dedicated travel lanes become viable. So do light rail and other basic rail services. Greater concentration of trip origins and destinations through mixing of land uses generates additional trips, while such factors as increased automobile traffic and parking costs encourage a shift to transit.22
Transit achieves its highest ridership at population densities of over 15,000 people per square mile. Due to high levels of traffic congestion and scarce parking on valuable land, the highest share of trips are taken on modes other than private automobiles. To meet the likely demand for this level of density, high capacity transit systems, such as heavy rail subways and metro networks, are essential. These areas exist in a variety of American cities, including such car-dependent metropolitan areas as Los Angeles and Houston, not just the traditional “transit cities.”23
The Denver region’s population and geographic analysis
Across the Denver region, population density within a 0.5-mile walkshed of RTD rail transit stations is 5,394 people per square mile.24 This means current land use patterns near rail transit are far below the densities needed to support the transit service they receive. Furthermore, many of the region’s densest census tracts are excluded from easy rail transit access because planners routed lines around them.
In Figure 3, census tracts across the RTD rail transit service area are shown across four categories corresponding to population density. Many neighborhoods in the region fall in the yellow density band of 3,000 to 10,000 people per square mile. This means they are well suited for ordinary bus service but not for more costly rail service. Some areas in the orange band of 10,000 to 15,000 people per square mile are clustered around Denver’s downtown and scattered in other parts of the region.
Many of these areas that would be suitable for rail transit outside the downtown area are not served by the RTD rail transit system. Areas with the highest population density, in the red band of 15,000 or more people per square mile, extend between the Union Station and Capitol Hill neighborhoods of Denver proper, but even several of these areas are not served by rail transit. Yet several tracts in the lowest-density areas are (e.g., green, less than 3,000 people per square mile) even though urban planning literature would not recommend this population density even for regular bus service.
Fig 3: Denver census tracts and RTD rail stations and lines
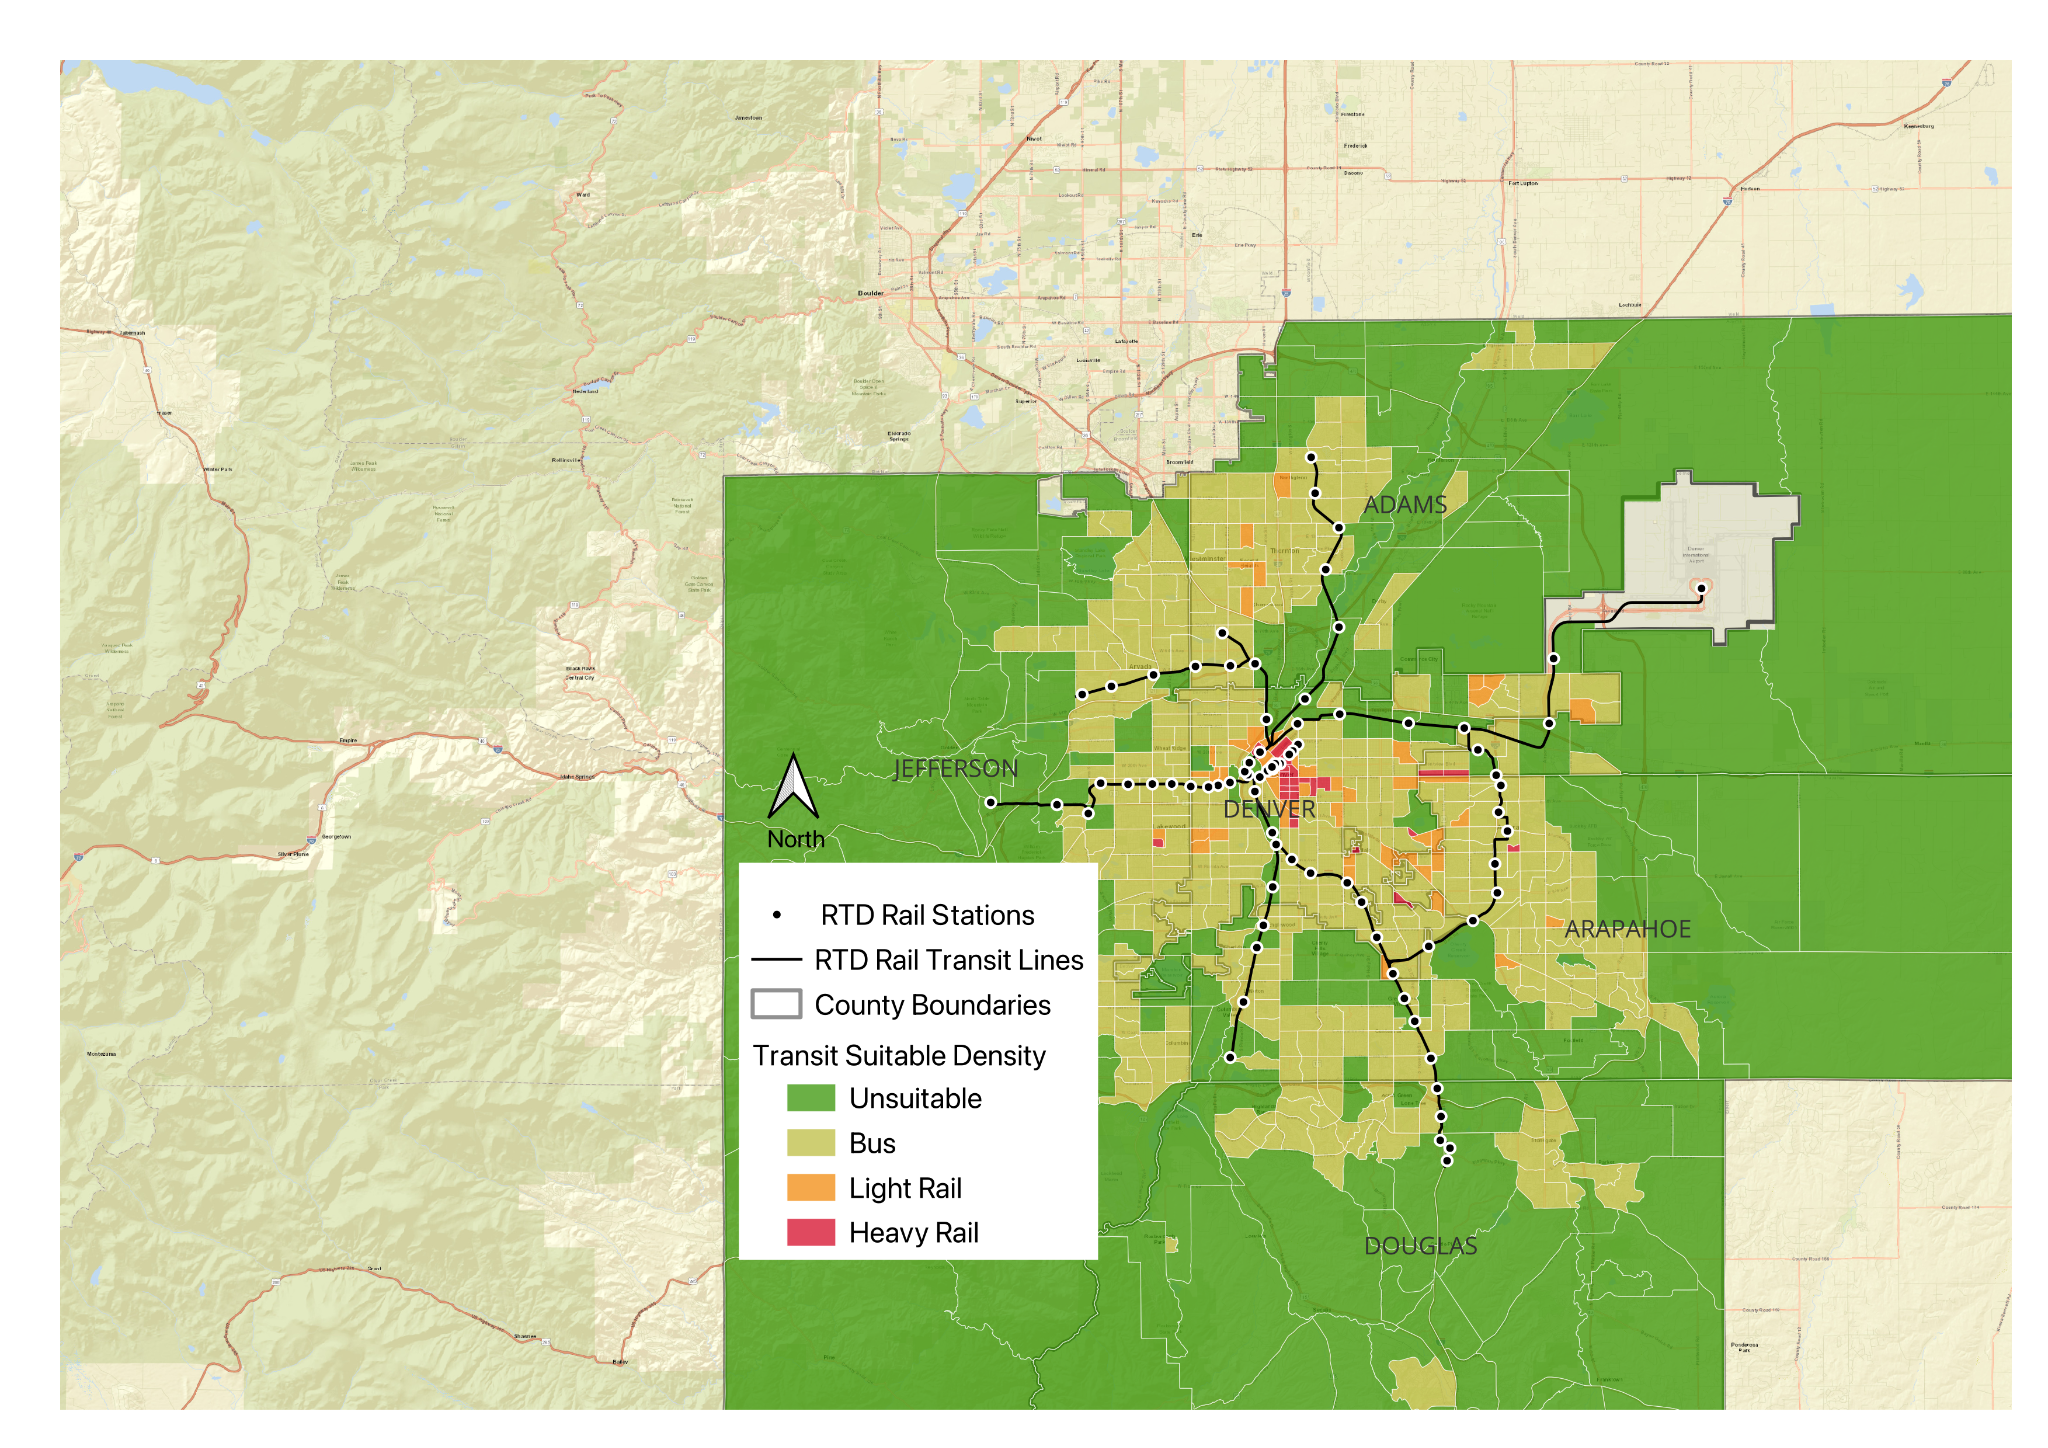
The densest census tracts in the Denver region are highlighted in red, and the map shows they are not generally near RTD rail stations. These tracts have over 15,000 residents per square mile, enough to support heavy rail rapid transit. Orange tracts are the next densest, with between 10,000 to 14,999 residents per square mile, enough to support light rail. Yellow tracts have between 3,000 and 9,999 residents per square mile, enough to support bus service. Green tracts are below 2,999 people per square mile, too low to support bus transit. Note how regularly lower density tracts are directly served by RTD rail transit stations.
Many of the region’s rail transit stations do not currently have supportive population densities. Thanks to ample park-and-ride lots at over half of all stations, many station areas have even lower population densities than the surrounding neighborhoods.
The Denver region’s underdevelopment is widespread, not just encompassing a few neighborhoods. Figure 5 illustrates just how low-density some station areas are and how little land is currently available for useful development near transit once areas cut off by highways and other obstacles are excluded from the walksheds.
Fig. 5: RTD rail station walksheds showing population densities by census tract
Note that due to poor pedestrian connections around many stations, walkshed coverage is far below 0.5 miles in all directions, limiting buildable area with good transit access.
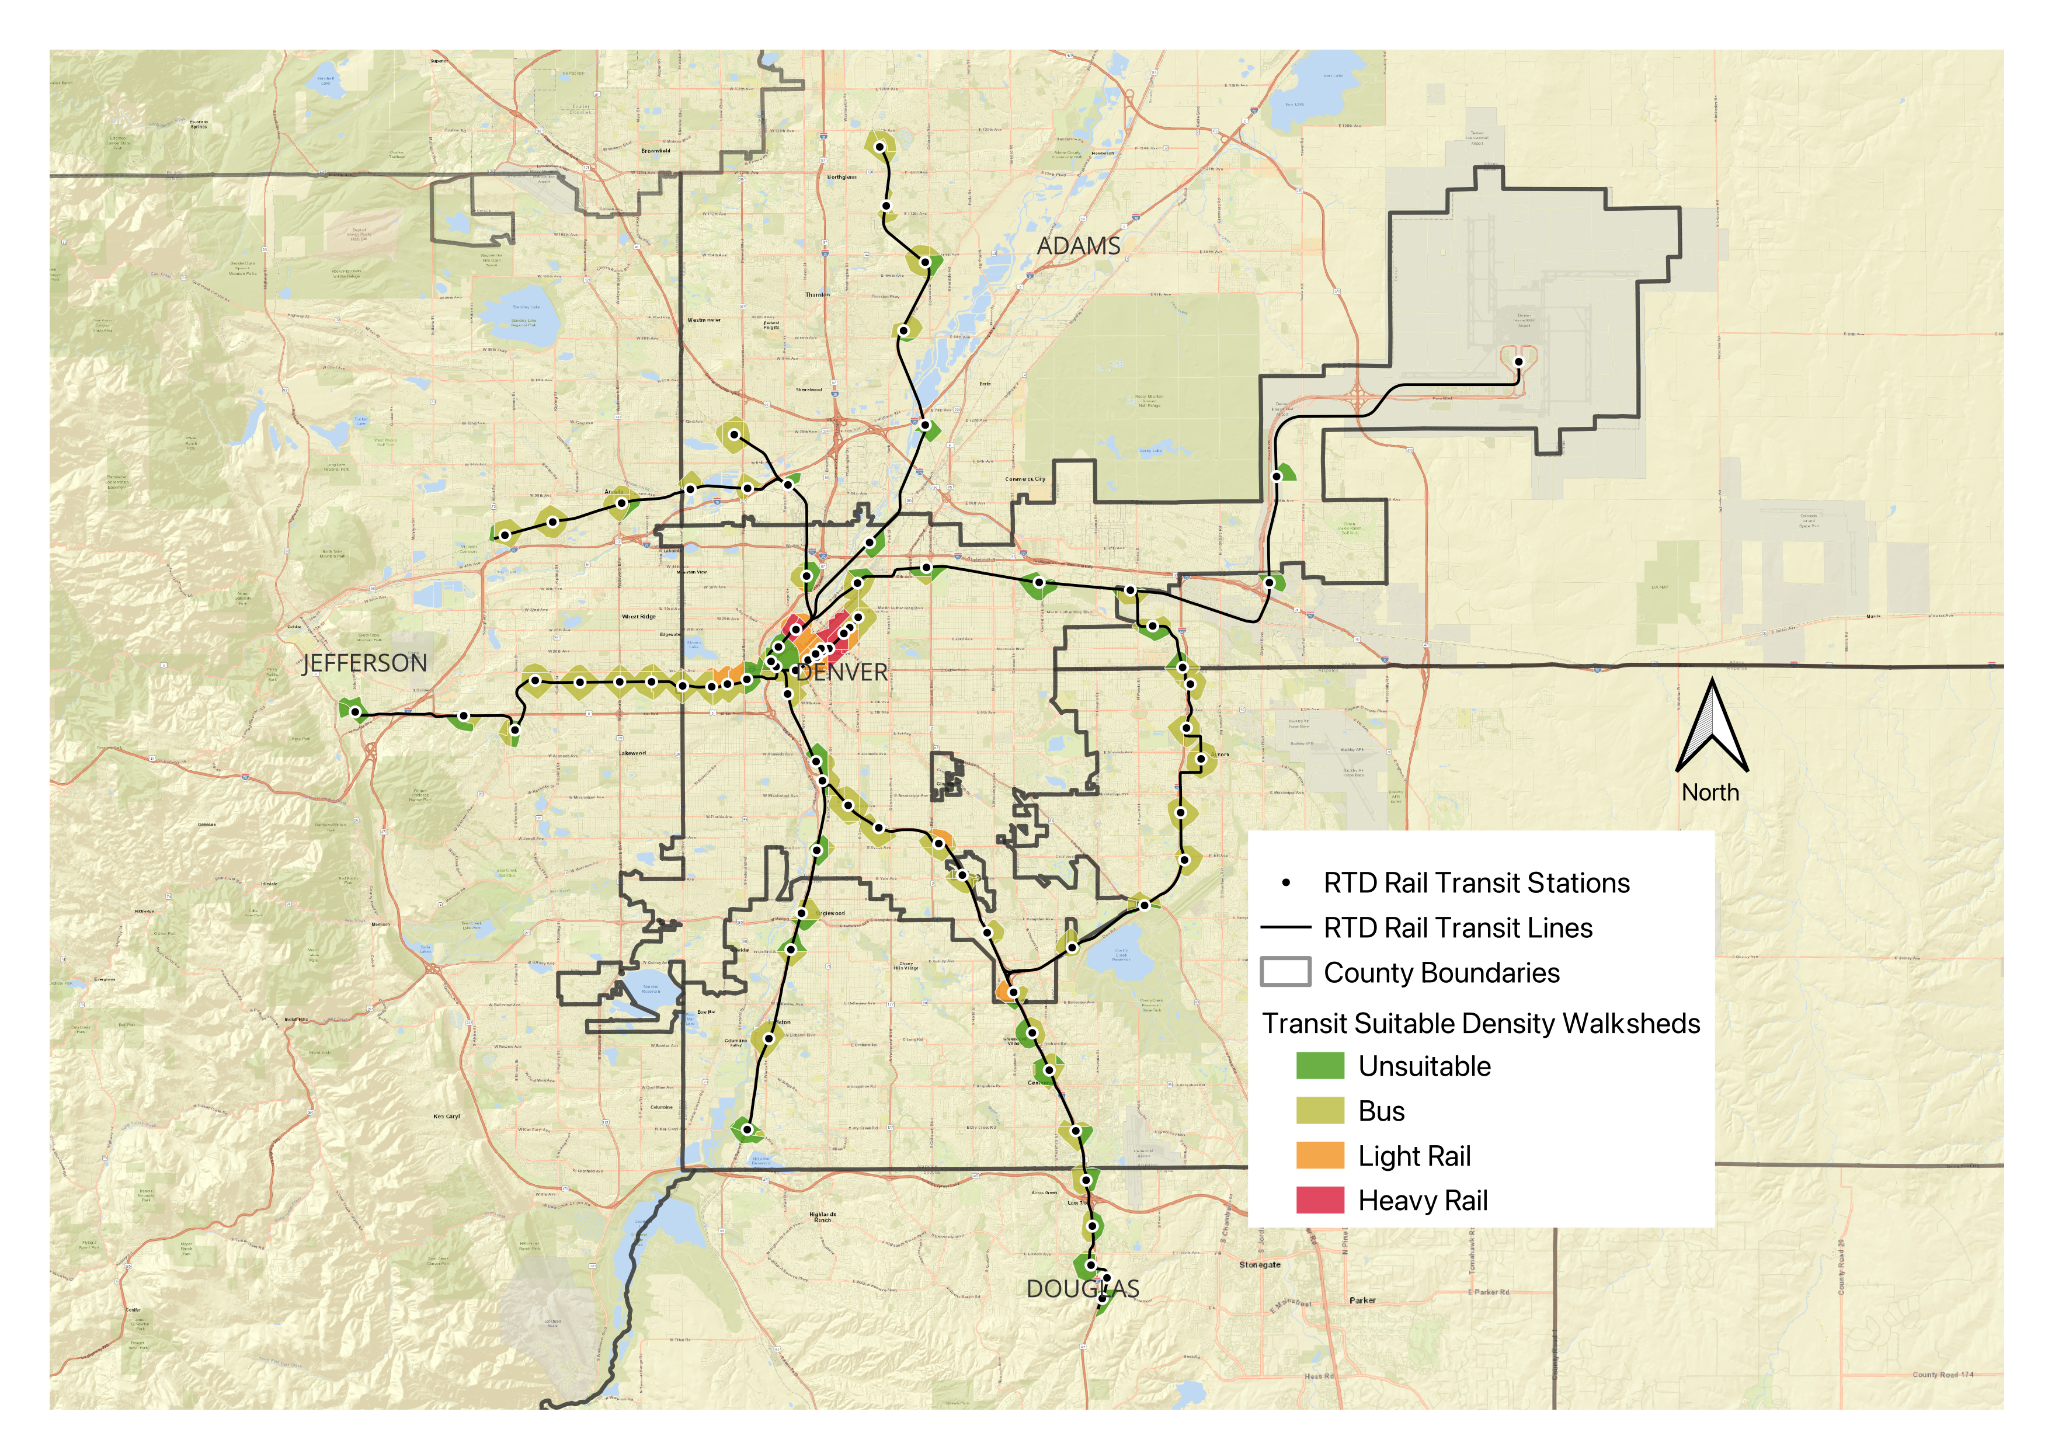
Across the region, the 0.5-mile and 0.25-mile transit areas around rail stations and select bus routes contain 139.9 square miles of land without subtracting exempted parcels covered under the TOC law.25 At 40 units per acre, this requires zoning for about 3.6 million housing units across the communities covered by the law within the RTD rail service area.
Applying the TOC law to the RTD rail system in and near Denver
As noted earlier, the law’s housing-opportunity goal formula excludes parks, cemeteries, floodplains, and agricultural and forestry land within transit areas. Because the land is exempt from development, there is a population shortfall near existing transit access points — that is to say, commuters aren’t allowed to live near enough to the train stations to make taking the train worth it, or to keep the transit system afloat. The solution is to make up the shortfall by allowing higher-density housing development on nonexempt parcels near enough to the transit stations to encourage people to take the train to their everyday destinations.
The following figure shows total transit area land across the region outlined in blue, without any parcels exempted. Walksheds around rail stations are shown in the four colors from the census tract density bands, clipped to the shapes of the 0.5-mile walksheds around each station. Combined, this shows how much smaller many of the walksheds are than the transit area calculations, reflecting street network design, station siting, and other constraints that make walking to or from the stations less efficient.
Fig. 4: Transit areas designated by the TOC law
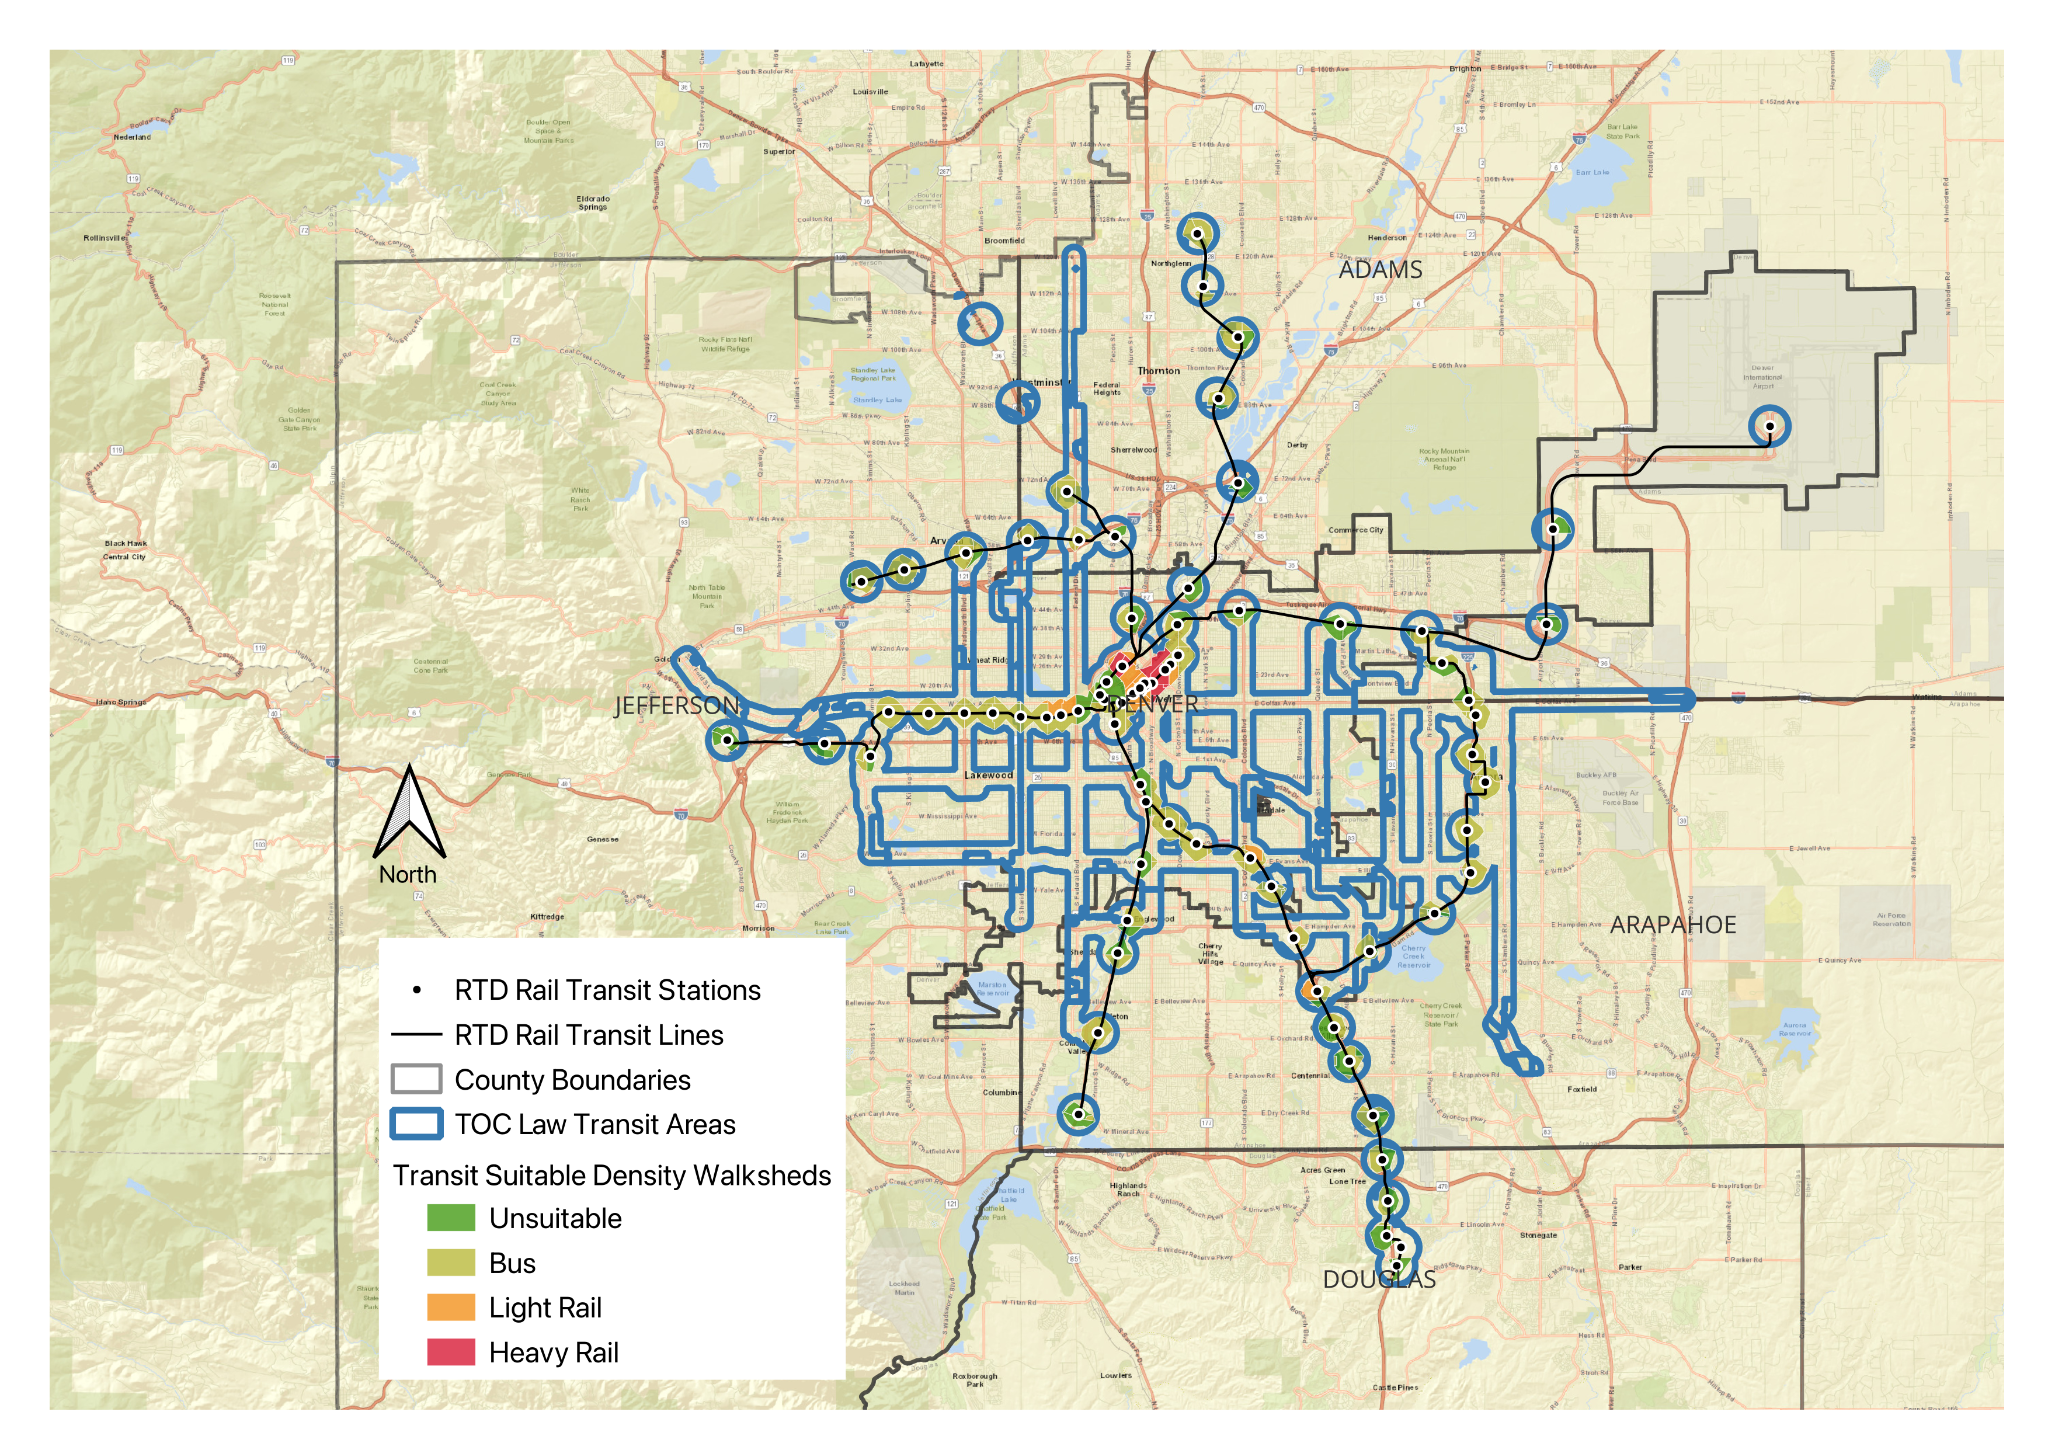
Figure 4 shows transit areas designated by the TOC law with a 0.5-mile radius surrounding RTD rail transit stations and bus rapid transit stations, and a 0.25-mile buffer around select bus routes. The Transit areas cover 139.9 square miles in the five-county area and are counted toward the TOC law’s housing opportunity goal. The walkshed areas cover 24.5 square miles and are used as transit centers in upzoning calculations. Drawing 0.5-mile walksheds around the region’s rail transit stations to create transit centers under the law covers 24.5 square miles of land area, and 133,512 existing residents.26
Assuming growth from upzoning near transit in addition to other housing growth in the region, and assuming the regional average of 2.4 persons per household, the regional population is projected to reach up to 5.2 million in 2067 based on the upper bound of the buildout assumptions in Table 1.27 While this is an upper bound for growth under the TOC law, it matches the expectations in the planning literature and the state’s TOC implementation handbook.28 Without the TOC law, the region could still grow to about 4 million by 2067 based on an exponential decay model continuing past growth trends. See Appendix A for more information on how we calculated population growth and buildout.
The state’s TOC implementation handbook tells localities to expect between 10 percent and 20 percent buildout of new zoned capacity.29 Because the average of this assumption —15 percent buildout — would deliver such a significant increase above the current growth trend, it’s worth exploring lower buildout rates since they may be more likely. Factors such as “soft site conversion” suitability affect the number of existing sites that would be redeveloped to a higher density under the policy. If the gap between the existing condition and the optimal buildout on a site is not large enough to warrant redevelopment, this would reduce the share of total zoned capacity ultimately filled.30
Using the baseline assumption of 15 percent buildout, over the buildout period the TOC law would deliver over 1 million units above current trends in the region; at 10 percent, it would deliver about 700,000 units above the trend; and at 5 percent, about 290,000, as shown in Table 1.
Table 1: Regional population growth over time and under different projections
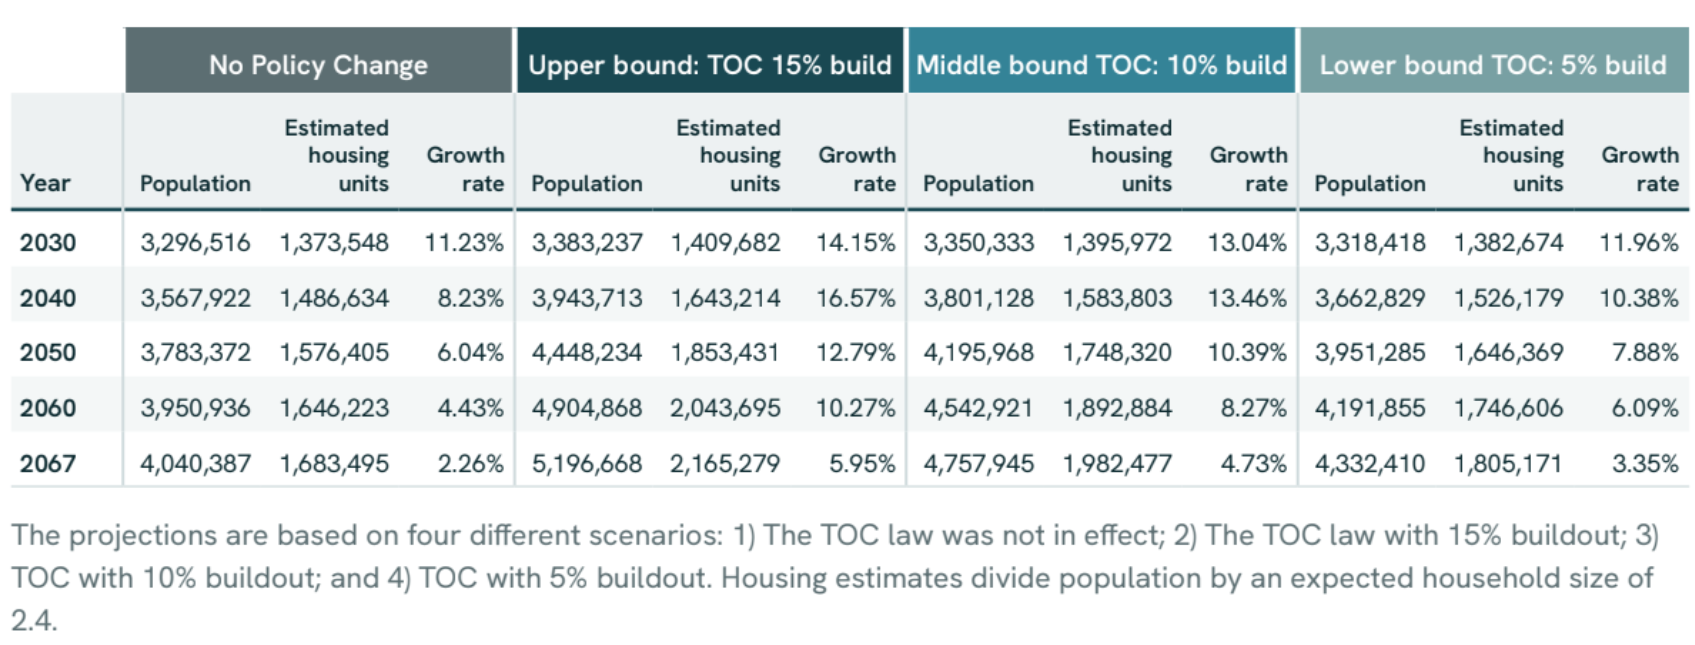
The projections are based on four different scenarios: 1) The TOC law was not in effect; 2) The TOC law with 15% buildout; 3) TOC with 10% buildout; and 4) TOC with 5% buildout. Housing estimates divide population by an expected household size of 2.4.
Ridership impacts under increased population density
Between 2022 and 2024, the RTD rail system averaged around 20 million annual riders. Using the 15 percent buildout assumption, station-area population density could eventually increase to over 50,000 people per square mile. Under the 10 percent and 5 percent buildout scenarios, it would reach 34,000 and 17,000 people per square mile, respectively.
Assuming new residents would ride the rail system at the same rate and with the same travel patterns as they do now, under these buildout scenarios the system would expect anywhere between a 200 percent and 800 percent increase in ridership.
Such a substantial increase in ridership makes it difficult to calculate how fare revenues offset the cost of operating the service. More service, different operating patterns, and possibly more complex infrastructure would be required to accommodate so many new passengers on the existing RTD rail transit system. In fact, the densities could be so high that the system may not be able to accommodate that level of ridership without significant capital investment.
A system such as the RTD will, of course, continue to have substantial fixed costs associated with maintaining and running it. Costs related to administration, track maintenance, lighting, and snow clearing are likely to be relatively constant as ridership changes. At the same time, variable costs — driver wages, electricity to power trains, vehicle maintenance and such — will change as ridership changes and the system runs more or less service in response.31
These variable costs should only begin to rise after significant growth that requires running more trains. This is where the RTD rail system is at an advantage compared with a system that relies solely on buses, or compared with a scenario in which population growth is concentrated along frequent bus lines. Each train can accommodate hundreds of passengers, or as many as several buses. In that case, the agency would need fewer new drivers, or less driver overtime, to meet service needs than if additional ridership had to be accommodated on buses. Growing ridership should improve the farebox recovery ratio as fixed costs remain more or less constant and variable costs rise more slowly.
Recommendations for implementers
Increased housing supply near transit and the growth in ridership that comes with it will benefit the RTD. That’s true, too, for localities, which over time should benefit from growing economies and expanding tax bases. But outside assistance could help localities cover significant near-term costs to accommodate growth, such as expanding school facilities, hiring public safety personnel, and building new infrastructure.
The State support could come in the form of additional infrastructure and public services funding to help localities transition to higher-density development with minimum strain on their fiscal health. Longer term, state assistance could help localities with substantial new costs for new public safety, education, sanitation, and water infrastructure that accompanies population growth. The TOC law’s one-time $35 million infrastructure fund is a start, but it represents a very small incentive relative to the scale of housing growth projected under the law. Communities across Colorado will likely need more support to accommodate the scale of growth the law makes possible, and the long duration needed to achieve buildout under the revised local zoning rules should be reflected in the support program.
For example, the existing state infrastructure bank already supports transportation investments; broadening its authority to cover other capital improvements could further support communities with favorable financing as they grow.32 In states that offer financing for infrastructure improvements, communities benefit from reliable funding options for infrastructure without extracting high impact fees from developers to finance public improvements that make new housing construction more difficult and therefore expensive.33
In lieu of high impact fees, Colorado should consider a reverse impact fee linked to TOC buildout.34 A modest per-unit grant to local governments for every housing unit permitted within the TOC law’s transit centers, conditioned on the local government not charging a traditional impact fee to the developer, would make this type of infill development more attractive to cities and developers. By boosting transit ridership, these grants could be partially offset by lower operating subsidies for RTD as the agency attracts more riders and collects more fare revenue.
Housing supply and transit success linked under TOC law
Colorado’s TOC law is a potentially effective step toward broadly incentivizing transit-oriented development across the state. As written, the law could drive significant growth of housing supply near transit in the Denver region and place the RTD rail transit system on a strong financial footing through greatly increased ridership. Other states could benefit from taking Colorado’s approach that pairs flexibility with accountability for localities.
Success of the TOC law in the Denver region will ultimately rely on the health of the RTD rail transit system, and its ability to support housing supply growth and help communities welcome new residents in new or expanded transit-oriented neighborhoods. The relationship between RTD and the region’s localities is a symbiotic one that the state should support by helping localities accommodate growth over the next few decades to ensure the success of its TOC policy and the state’s future prosperity.
###
Andrew Justus is a Housing Policy Analyst at the Niskanen Center, where he works on urban issues including housing, transportation, and infrastructure, with an emphasis on housing abundance.
Previously, Justus was an associate attorney at a D.C. land use and zoning firm, where he focused on residential development. Before that, he worked in transportation and development policy at a national nonprofit. Justus earned a master’s degree in urban and regional planning from the University of Michigan, a law degree from Western Michigan University Thomas M. Cooley Law School, and a bachelor’s degree from Grand Valley State University.
Appendix A: Calculating people per square mile from zoned capacity and household size
If the zoned capacity under the Transit Center upzoning is perfectly built out, it would yield 347,377 people per square mile.35 Zoned capacity is never completely built out at a broad scale. Therefore, it should be set some multiple above the target population density to account for slow turnover of existing housing stock, inefficient interactions between property characteristics and other regulations that result in new buildings being completed below their theoretical zoned maximum. Furthermore, it is often uneconomical to tear down and rebuild existing buildings that are close to but not at the zoned maximum if there is not a significant amount of new floor space to be unlocked under the higher zoned capacity limit.
A study of zoned capacity across New York City’s five boroughs showed 14.2 percent buildout of zoned capacity after roughly four decades.36 Rounding that figure to 15 percent, it is also consistent with the State of Colorado’s handbook for localities that are implementing the TOC law. The handbook advises communities that typical buildout of zoned capacity in the state falls between 10-20 percent.37
Calculations under the TOC law results in a zoned capacity for the rail station walksheds of 226.1 units per acre, or 3.5 million total housing units spread among the station walksheds. Using a 15 percent buildout of zoned capacity and the regional average household size of 2.4 people, would eventually deliver 52,106 residents per square mile in the transit walkshed areas after buildout. This degree of buildout would represent a 966 percent increase in population density within the walkshed over the current condition and accommodate an additional 1,156,281 residents in the region after the buildout period.38 This increase is far in excess of what is needed to sustain robust RTD rail service for the region.
It is possible that the buildout of zoned capacity assumption from the state’s guidance materials is too high. Many factors weigh on eventual buildout of zoned capacity. Degree of underutilization of existing buildings, the amount of growth permitted by the new rules above what is currently built, even parcel sizes and shapes all weigh in. To better understand lower bound possibilities we modeled 10 and 5 percent buildout scenarios as well. At these levels, station area walksheds would see an additional 717,558 new residents after the buildout period under the 10 percent scenario. If only five percent of zoned capacity is built out, then the region would see 292,023 new residents in the walkshed areas.
Extrapolating regional growth trends over a four-decade buildout period the region would reach 4.04 million residents by 2067 with no TOC law and growth following an exponential decay model every decade.39 We use an exponential decay model because it captures the region’s slowing growth rate since the year 2000, and simulates ongoing growth at a diminishing pace as new greenfield development sites are further from the region’s job centers, and as the western edge of the region abuts the Front Range further reducing buildable sites. An alternative method, where growth from the previous census is extrapolated at the same rate throughout the buildout period, would not have accounted for the recent slowdown in growth nor the geographic constraints of commuting distance and mountainous terrain. Under the 15, 10, and 5 percent buildout scenarios, total regional population reaches 5.19, 4.75, and 4.33 million residents respectively as the TOC upzonings contribute smaller shares of overall growth.
- Typical median home price to median income for metro areas in the U.S. have hovered between 3:1 and 4:1 between 1990 and the present day, excluding run-ups before the Great Recession and in the post-COVID home-price boom. Peyton Whitney, “Home prices surge to five times median income, nearing historic highs,” Harvard Joint Center for Housing Studies, Oct. 6, 2025, accessed Sept. 18, 2026. ↩︎
- Alayna Alvarez,, "RTD’s ridership decline deepens," Axios Denver, Aug. 13, 2025, accessed Nov. 14, 2025. ↩︎
- Colorado General Assembly, HB24-1313, 2024, accessed April 8, 2025. ↩︎
- Rather than duplicate work that the City of Denver and other local governments are already doing to determine what parcels should be excluded under the law, we include the maximum amount of land reachable within a 0.5 mile walk from rail transit stations, referred to as the "walkshed." ↩︎
- Washington State’s Transit-Oriented Development law requires cities to allow more floor area (i.e., larger buildings) near rail and bus transit, it also bars localities from mandating minimum parking requirements near major transit stops. California’s transit-oriented housing law, which went into effect in July 2026, directly overrides local zoning and sets height and density minimums for parcels near transit stops based on the type of transit offered in the area. Maryland’s Transit-Oriented Development Reform Act, adopted in 2025, requires localities to allow mixed-use development near rail transit stations and bars localities from requiring parking minimums near rail transit. The law also allows the state to develop land it owns near transit even if it means overriding local zoning for the parcels. ↩︎
- Commonwealth Beacon, Researchers find MBTA housing law benefits ‘modest’ so far, Sam Drysdale, Jan. 28, 2026, accessed April 8, 2026. ↩︎
- Boston Indicators, An early look at the MBTA Communities permitting pipeline, Amy Dain, Jan. 28, 2026, accessed April 8, 2026. ↩︎
- Alex Armlovich, Zoned Capacity is like an Artificial Oil Deposit, Abundance and Growth Blog, April 2, 2026, Accessed April 16, 2026. ↩︎
- Notwithstanding the Great Depression and two world wars, 41 years of buildout to reach such a low share of zoned capacity should give policymakers pause in setting zoned capacity targets too close to their desired density outcomes. This example indicates that in the most in-demand places on a long timeline, buildout well below 50 percent of zoned capacity is reasonable to expect. Rezoning New York City: a guide to the proposed comprehensive amendment to the zoning resolution of the city of New York / City Planning Commission. ↩︎
- Cervero, R. Transit-oriented development’s ridership bonus: a product of self-selection and
public policies, Sept., 2007, accessed Jan. 15, 2026. ↩︎ - Denver International Airport (DEN) is exempted from this study because it is impractical for people to live at the airport, nor would it be beneficial to require people to live near the airport since the edges of the airfield are far beyond the walkshed of the airport transit station. The airport is also a significant trip generator in its own right. In 2024, 82 million passengers used DEN. The airport and other businesses on the site also employ 40,000 people who commute there regularly. ↩︎
- Colorado General Assembly, HB24-1313, 2024, accessed April 8, 2025. ↩︎
- Colorado Housing Finance Authority, Transit Oriented Communities Credit, accessed June 26, 2026. ↩︎
- Bente Birkeland, "$280 million at stake if Colorado cities don’t start complying with housing policies," Colorado Public Radio, Aug. 13, 2025, accessed Sept. 17, 2025. ↩︎
- Regional Transportation District, RTD FasTracks 2016 Fact Sheet, 2016, accessed Feb. 20, 2025. ↩︎
- Nathaniel Minor, “Denver’s train network was built for car commuters. With parking lots empty, RTD thinks housing could save it,” Colorado Public Radio, June 21, 2024, accessed April 15, 2025. ↩︎
- American Public Transit Association, Public Transit Ridership Report First Quarter 2026, accessed June 26, 2026. This figure divides weekday boardings of 38,400 by the light rail system length of 60.1 route miles. ↩︎
- One exception is the four-stop B-Line route between Union Station and Westminster, which operates every 60 minutes. ↩︎
- Texas A&M Transportation Institute, “Heavy Rail,” accessed Sept. 24, 2026. ↩︎
- Code of Federal Regulations, 49 C.F.R. 37.3, Definitions, accessed on Dec. 15, 2025. ↩︎
- Christof Spieler, Trains Buses People: An Opinionated Atlas of US and Canadian Transit, p. 34-35, Island Press, 2021.
Leah Binkovitz, Excerpt: many cities have transit, how many have good transit? Urban Edge, Kinder Institute for Urban Research, Rice University, Nov. 13, 2018, accessed Dec. 16, 2024. ↩︎ - Ibid ↩︎
- Ibid ↩︎
- GIS data using U.S. Census 2020 decennial census data. According to the 2020 census, Denver’s citywide population was 715,522, and it has been steadily increasing since the 1990 census. The regional population was 2,963,821 as of the 2020 census. The region has averaged 28 percent population growth every decade since 1900 and saw 16.53 percent growth from 2010 to 2020. Regional population density in counties with RTD rail service is 760.7 people per square mile, while Denver’s citywide population density is 6,226 people per square mile. ↩︎
- The square-mile figure was derived from GIS data for a 0.5-mile buffer around rail transit and BRT stations and a 0.25-mile buffer around select bus routes in the five-county service area. The actual figure is 139.950 square miles. ↩︎
- Calculation assumes equal distribution of people across a census tract, with the walkshed population calculated as a portion of the total tract population equal to the walkshed’s share of the tract’s land area. ↩︎
- Denver Regional Council of Governments, “Appendix B. Regional Housing Trends,” page 5, Oct. 10, 2024, Accessed Sept. 22, 2026. ↩︎
- State of Colorado, HB24-1313 Guidance: Housing in Transit-Oriented Communities, page 7, Feb. 28, 2025 Last updated Aug. 8, 2025. Accessed Oct. 17, 2025. ↩︎
- Id. ↩︎
- Alex Armlovich, Zoned Capacity is like an Artificial Oil Deposit, Abundance and Growth Blog, April 2, 2026, Accessed April 16, 2026. ↩︎
- Jean-Paul Rodrigue and Theo Notteboom, The Geography of Transport Systems, Sixth edition, Ch. 3 Transportation, Economy and society, 3.3 Transportation Costs, 2024. Accessed March 11, 2026. ↩︎
- Colorado Department of Transportation, State Infrastructure Bank information, accessed Oct. 21, 2025. ↩︎
- Lourdes Germán and Andrew Simmons, U.S. state investments in water, sewer, and transportation infrastructure: a survey, Public Finance Initiative, Aug. 19, 2024. ↩︎
- Impact Fee Primer, National Association of Home Builders, March 2025, accessed Oct. 27, 2025. ↩︎
- Total housing opportunity goal of 3,582,760 divided by square miles of transit center walksheds 24.573, multiplied by average household size. ↩︎
- Rezoning New York City: a guide to the proposed comprehensive amendment to the zoning resolution of the city of New York / City Planning Commission, City of New York 1959, accessed Sept. 30, 2025. ↩︎
- State of Colorado, HB24-1313 Guidance: Housing in Transit-Oriented Communities, page 7, Feb. 28, 2025 Last updated Aug. 8, 2025. Accessed Oct. 17, 2025. ↩︎
- 226.156 units per acre is equivalent to 144,739.84 units per square mile. This, multiplied by the average household average size in the Denver-Aurora-Centennial MSA of 2.4 persons per household yields 347,377 people per square mile of zoned capacity. Reducing that figure to assume 15 percent buildout of the zoned capacity yields 52,106.55 people per square mile, well above the 10,000 people per square mile target. Household size may be toward the upper bound for infill households near transit. The existing station walkshed density is 5,393.77 people per square mile. Increasing this to 52,106.55 would yield a 966 percent increase in density. Net population increase is equal to expected buildout population at 1,289,793.432 then subtracting existing walkshed area population of 133,512. Under the middle and lower bound scenarios, population density would increase by 537 and 218 percent respectively compared to the pre-law baseline. U.S. Census data, American Community Survey, 2024, Table B11002, Accessed March 6, 2026. ↩︎
- Exponential decay model uses growth figures from the 1990-2020 decennial censuses and models a continuation of that trend to simulate continued slowdown of exurban growth as easily buildable land in the regional commute zone is exhausted. From 1990-2000 the region grew 30.73%, from 2000-2010 it grew 17.88%, and from 2010-2020 it grew 16.53%. ↩︎