Writing recently for the Niskanen Center, Brink Lindsey explores America’s crisis of state capacity – what it is, how we lost it, and how to get it back. The problem is fundamental. The United States would seem to have all the institutional building blocks of a strong liberal democracy: checks and balances, the rule of law, a Bill of Rights, free and fair elections, property rights, and more. Yet, our government can’t perform many of the basic functions we expect. Partisan gridlock blocks urgently needed legislation. Our level of public safety at home is far from what it should be, while our uber-powerful armed forces have less-than-consistent success against ragtag adversaries abroad. Billionaires play with space toys, while poverty rates have flatlined for decades. Trust in government is pathetically low.
Lindsey warns that what is at stake “is not just the prospect of effective public policy in a wide variety of important domains; at this point, the legitimacy and continued vitality of liberal democracy have been endangered as well.” From an empirical, cross-national perspective, this commentary follows up on that concern by exploring the relationship between state capacity and liberal democracy. As I will show, available data confirm that around the world, liberal democracy and state capacity do, by and large, go hand in hand. The idea that authoritarian regimes can achieve state capacity superior to the best liberal democracies is a myth. And countries that manage to combine strong liberal democracies with low state capacities are few and far between.
Despite the shortcomings that Lindsey points out, America can still claim membership in an elite club of high-capacity, highly liberal democracies. At the same time, though, we are less of a shining city on a hill than patriotic rhetoric would have it. We have work to do.
Defining and measuring
Most of what follows will be devoted to ranking and comparing countries of the world in terms of their state capacity and liberal democracy. The first step is to define those concepts as clearly as possible and identify data that allow them to be measured.
In previous work (see here for a succinct summary) I have followed the lead of Kevin Vallier in defining liberal democracy in terms of a set of liberal rights practices – rights “recognized in constitutional law, exercised regularly by the people, and embodied in public policy.” These include principles of constitutionally limited government, markets and private property rights, personal freedoms, electoral democracy, and social protection policies. A long tradition in political philosophy endorses these practices as things governments ought to do and which citizens ought actively to support. They can thus be seen both as a set of normative values that define liberal democracy and as observable characteristics of public policy to which it is possible to assign objective numerical scores.
In contrast, writers on state capacity are interested less in what the state ought to do than in what it can do. For good reason, Noel Johnson and Mark Koyama, cited by Lindsey, employed italics when they defined state capacity as “the ability of a state to collect taxes, enforce law and order, and provide public goods.” Another pair of scholars, Jonathan Hanson and Rachel Sigman, explicitly eschewing normative discussion of what constitutes a legitimate exercise of state power, focus on the ability to manage the apparatus of government, protect against external threats, maintain internal order, and provide a sound framework for economic activity. In shortened form, they refer to these capacities as “administrative, coercive, and extractive,” with “extractive” referring to the ability of the state to obtain the resources, through taxation or otherwise, that it needs to carry out the functions of government. In what follows, I will refer to these three basic areas as the administrative, security, and fiscal capacities of government.
As the principal source for the data needed to construct scores for liberal democracy and state capacity, I rely on the Legatum Prosperity Index (2020 edition). The Legatum dataset consists of 294 indicators organized into 65 elements, each of which is a weighted average of several closely related indicators.
In scoring liberal democracy, I have made only a few modifications to the approach I have used in earlier work. The overall liberal democracy score is an unweighted average of five components, which in turn comprise a total of 81 individual indicators:
- Limited Government: Executive constraints, rule of law, and government integrity.
- Quality of Market Institutions: Regulatory quality, property rights, investor protections, and contract enforcement.
- Personal Freedom: Agency (the right to act independently and to make free choices), assembly and association, speech and access to information, and absence of official discrimination.
- Procedural Democracy: Democracy in the narrow sense of process and procedures, rather than outcomes. (Legatum calls this “political accountability.”)
- Social Protection. The unweighted average of three items: An index of the satisfaction of needs for shelter, food, and basic services drawn from the Legatum data; a Gini index (a measure of income inequality) from a study by Laurence Chandy and Brina Seidel; and a measure of social protection expenditures as percent of gross national income (GNI) based on data from an ILO report on World Social Protection.
In measuring state capacity, the writers referenced above and others have used various sources and methods.My approach, which follows the general direction of the existing literature, selects elements from the Legatum dataset that highlight the “can” side of the can/ought distinction that differentiates state capacity from liberal democracy. My overall score for state capacity is an unweighted average of the following three components:
- Administrative Capacity: An average of seven indicators that focus on the government’s ability to prioritize and carry out its chosen objectives. Legatum calls this “government effectiveness.”
- Security Capacity: An average of Legatum elements that cover violent crime, property crime, and war.
- Fiscal Capacity: I use country credit ratings as aggregated by Legatum based on data from S&P, Moody’s, Fitch and DBRS. (Other writers have used indicators such as the level and structure of taxation, budget balance, and macroeconomic stability to measure the “extractive” component of state capacity. All of those considerations, and more, go into the country credit scores as compiled by the ratings agencies.)
As a check, I compared my measure of state capacity with the index calculated by Hanson and Sigman. Although the two indexes of state capacity have no specific indicators in common, and although the Hanson-Sigman data were assembled five years earlier, the two indexes are nonetheless highly correlated (R = 0.91). The strong correlation offers a degree of assurance that the approach used here falls within the mainstream of the state capacity literature.
Full definitions and data for both liberal democracy and state capacity are available as an online supplement.
The big picture
Figure 1 gives an overview of the relationship between liberal democracy and state capacity for 157 countries. The scores on both axes are presented in standardized form with values that indicate the number of standard deviations by which each observation falls above or below a mean of zero.
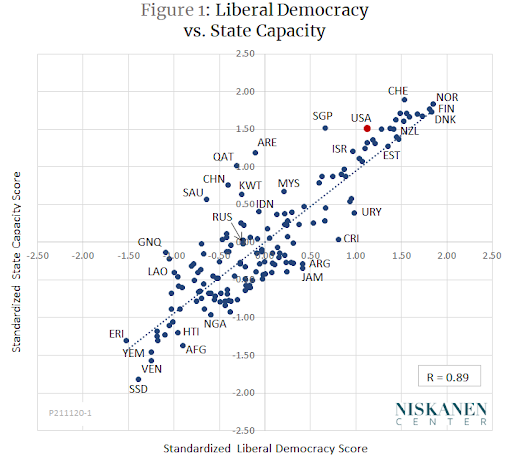
Most countries cluster fairly closely around a trend line along which state capacity and liberal democracy increase together. The following are a few noteworthy features of the distribution:
- The United States falls within a group of 24 countries that have scores for both liberal democracy and state capacity that are more than a full standard deviation above their respective means. However, it does not stand out as a leader among this group. Its ranking for liberal democracy (20th) is pulled down by poor component scores for the strength of social protections (37th in the world; see “America’s Social Protection Gap” for details). Its ranking for state capacity (13th) is pulled down by high crime rates that hold its security capacity to 48th in the world.
- None of the conspicuously illiberal countries outperform the best liberal democracies in terms of state capacity. However, some fall well above the trendline. (I will return to the cases of Singapore, China, and the Gulf states shortly.)
- Relatively few countries manage to combine substandard state capacity with a respectable level of liberal democracy. Uruguay, Costa Rica, Argentina, and Jamaica come closest to fitting this pattern. (In Chapter 11 of their book The Narrow Corridor, Daron Acemoglu and James A. Robinson call such states “paper leviathans” and offer some vivid examples.)
- Very high levels of war, crime, and terrorism are a signature trait of the failed and failing states at the lower left-hand end of the distribution in Figure 1. It is not easy to untangle whether high levels of violence cause low state capacity or vice versa. Probably it works both ways.
Liberal democracy, state capacity, and quality of government
As noted, Figure 1 reveals a strong correlation (R = 0.89) between liberal democracy and state capacity. The correlation is even stronger (R = 0.94) if we control for GNI per capita. Such strong correlations raise the question of whether or not the distinction between “can” and “ought” can really be maintained as cleanly as the definitions given above suggest. Are we dealing with two different things, or just two ways of looking at the same thing?
Table 1, which shows the correlation matrix for the eight components that make up the overall scores for liberal democracy and state capacity, sheds some light on this issue.
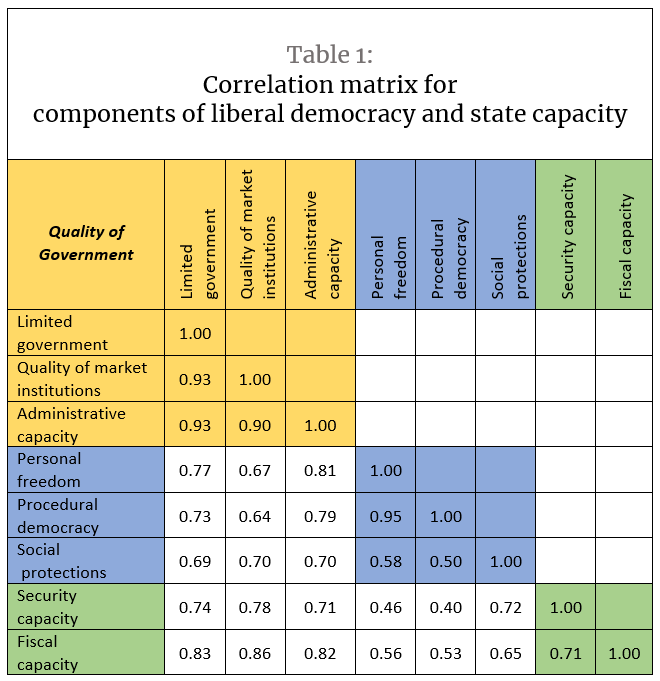
The table suggests a somewhat nuanced answer to the question of the relationship between liberal democracy and state capacity. The first thing to note is the strong correlations, all 0.90 or higher, in the highlighted block of cells that covers limited government, quality of market institutions, and administrative capacity. The temptation to see these three as no more than different perspectives on a common latent concept is strong. That impression is strengthened because it is hard on conceptual grounds alone to decide which category some individual variables should be assigned to. For example, is quality of regulation an aspect of quality of market institutions, or is it better seen as an aspect of administrative capacity? It’s a close call. The same goes for government integrity. Is using one’s government position for self-enrichment something that government officials ought not to do, or is it something that undermines the state’s ability to act effectively? Depending on the answer, it could be scored either as part of liberal democracy or part of state capacity.
But, if all of these three components are just aspects of the same thing, what is that thing? Clearly, it is quality of government. Combining limited government, quality of market institutions, and administrative capacity into a single concept would be very much in the spirit of the work of the University of Gothenburg’s Quality of Government Institute. In fact, in some of my own earlier research, influenced by the QoG Institute’s Bo Rothstein, I treated the data in just that way. (See, for example, “Quality of Government, Not Size, Is the Key to Freedom and Prosperity.”
But does that mean we should discard the concepts of liberal democracy and state capacity altogether? I think not. On a conceptual level, the distinction between ought and can is still valid. Rather, I think it is fruitful to view the two concepts as distinct but overlapping: Liberal democracy is quality of government plus personal freedoms and procedural democracy; state capacity is quality of government plus security and good management of government finances.
The idea of distinct but overlapping concepts is further supported by the relatively low cross-correlations shown in Table 1 among four non overlapping elements: personal freedoms and procedural democracy, on the one hand, and security capacity and fiscal capacity, on the other. For social protection, however – the remaining one of our eight components – we find a somewhat ambiguous pattern. Conceptually, my inclination, like Vallier’s, is to consider social protections as an element of liberal democracy — that is, as something the state ought to do. Empirically, though, the metric for social protection used here correlates more highly with security capacity and fiscal capacity than it does with personal freedoms or procedural democracy. Accordingly, those who see the ability to provide public goods as an element of state capacity might prefer to move social protection to that side of the ledger. The issue is probably worth some additional thought.
Some models of good government
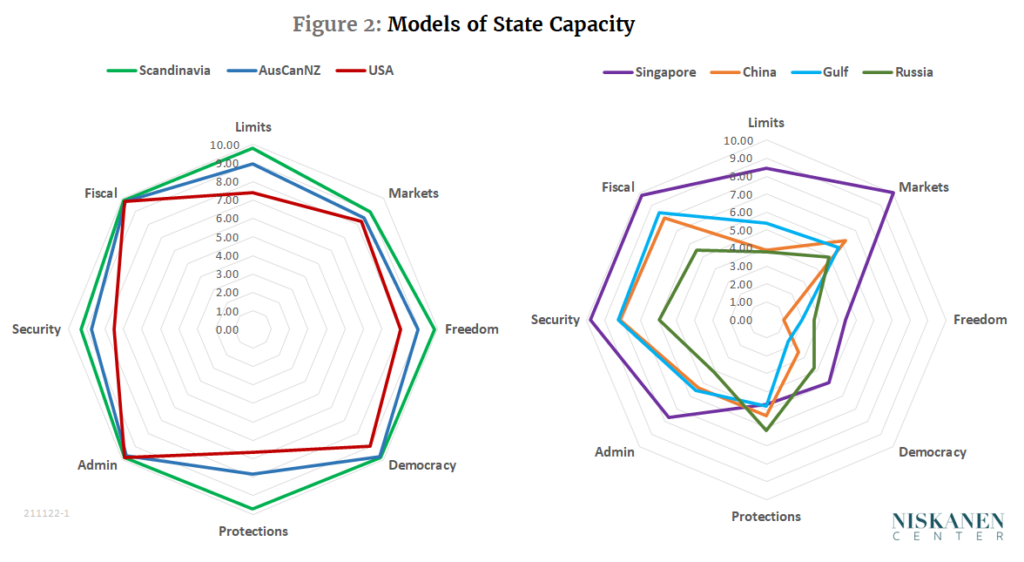
In conclusion, let’s return to the scatterplot presented earlier and take a closer look at some of the outliers that have especially high state capacity. Among them are a number of countries that are sometimes held out, or that hold themselves out, as models of good government. This section explores six such models. Three of them illustrate high state capacity combined with liberal democracy: The United States, a group of three Anglo-colonial countries (Australia, Canada, and New Zealand), and a Scandinavian group (Denmark, Finland, Norway, and Sweden). Three others are less liberal, combining high state capacity with scores below the global mean for personal freedom and liberal democracy: Singapore, China, and a group of four high-capacity Gulf oil states (United Arab Emirates, Qatar, Kuwait, and Saudi Arabia). I include Russia as a seventh example, partly because of its strong sense of national exceptionalism and partly because of personal interest in that country, even though its overall state capacity score is slightly below the global mean.
Figure 2 uses radar charts to compare the performance of the seven models in terms of the five elements of liberal democracy and the three categories of state capacity. Since radar charts cannot handle negative numbers, the data in this figure are rescaled in a way that assigns a score of 10 to the highest score in the full 157-country sample and zero to the lowest score.
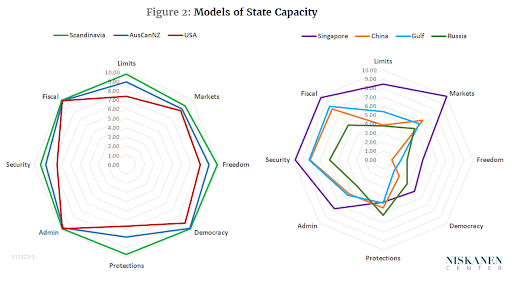
The three liberal democratic models shown in the left-hand chart do not differ dramatically from one another. All have nearly flawless scores for fiscal and administrative capacity. The United States falls especially far short of the others on security capacity (due to high crime rates) and social protections (due partly to a high Gini index). There are some interesting differences within the three sub-components (not shown separately in this figure) that make up the limited government score, namely, executive constraints, rule of law, and government integrity. The Scandinavian group shows comparably high scores on all three elements, and the Anglo-colonial group comparable, but slightly lower scores on all three. The United States scores well on government integrity but lags well behind on executive constraints and a little behind on rule of law.
The four less liberal models in the right-hand chart are more diverse. Singapore has the world’s highest score for quality of market institutions, giving it a perfect 10 there. Its fiscal and security capacity scores are also very strong. Singapore falls far short of liberal states in terms of procedural democracy and personal freedoms, but even there, it outperforms China, Russia, and the Gulf states.
The Gulf states and China have closely matching scores on the state capacity side, but greater differences elsewhere. China offers even less by way of personal freedoms than do the Gulf states, but rates as slightly less undemocratic. In the limited government department, China is pulled down especially by its lack of executive constraints. In contrast, China’s score for government integrity is slightly above the global average and not much different from the average for the four Gulf states.
Finally, Russia scores far less well in terms of state capacity than do the other illiberal models. In fact, its overall state capacity score is slightly (0.03 standard deviations) below the global mean. Although Russia is not close to being anything we would call a liberal democracy, its scores for personal freedoms and procedural democracy are nonetheless somewhat better than those of China or the Gulf States.
What have we learned?
The first thing we have learned in this commentary is that state capacity and liberal democracy are indeed strongly related. Around the world, failure to maintain a respectable level of state capacity is, with few exceptions, associated with low levels of personal freedom, procedural democracy, and social protections. In absolute terms, the United States ranks well above the global mean for both liberal democracy and state capacity, but when we control for income per capita, America scores well below the level that would be expected for such a wealthy country. Its income-adjusted state capacity is tied with Honduras and trails Pakistan and Albania. We should do better.
A second finding is that, by and large, the data do not support a claim that autocracies can make up in superior state capacity for what they lack in personal and political liberties. Even the unique example of Singapore does not achieve higher state capacity than the best liberal democracies. Although Singapore ties the United States for 13th highest in state capacity, it trails far behind – 35th against 20th – in liberal democracy, and has scores below the global mean for both personal freedoms and procedural democracy. China, which ranks 35th overall in state capacity and 103rd in liberal democracy, is another revealing case. When scores are adjusted for income per capita, China exceeds its expected level of state capacity by a larger margin than any other country in the world, but at the same time, its income-adjusted gap between state capacity and liberal democracy is also the world’s widest. China tries very hard, with its zero-Covid policy, its space program, and its thousands of kilometers of high-speed rail lines, to demonstrate that it has the ability to undertake any task it sets for itself. My take-away, however, is that in doing so, it pays an exceptionally high price in the form of diminished freedom and democracy.
In closing, it would be fair to say that these conclusions barely scratch the surface of what might be found by further poring over the data. One obvious avenue for investigation would be to look at trends over time. Lindsey maintains that U.S. state capacity is declining. If so, which elements of state capacity explain the decline? Another interesting question: Despite an overall positive correlation between state capacity and liberal democracy, cross-national data indicate that at the lowest end of the distribution, small increases in personal freedom and procedural democracy are associated with statistically significant decreases in state capacity. Can such a U-shaped pattern be found over time in individual states, or does the cross-national pattern have some other explanation?
It would be interesting also to introduce additional variables into the study. Among other things, the relationship between state capacity, liberal democracy, and per capita income, mentioned above only in passing, deserves a more systematic treatment. For another example, in an earlier commentary, I examined the relationship between quality of government, on the one hand, and social and political trust, on the other. How does state capacity play into that relationship? Also, what is the role of culture, in the interplay of state capacity and liberal democracy? And how do patterns of state capacity and liberal democracy differ across states with high and low natural resource endowments – the “curse of riches” question? In the course of this study, I found interesting hints regarding all of these questions that deserve further investigation.
Finally, in view of the wide variety of sources and methods used in the existing literature, there is plenty of scope for further thought about the proper place of government integrity, social protections, and economic elements in defining and measuring state capacity. Stay tuned to this channel.