
A new paper by Mears & Wentz (2016) presents an updated analysis of satellite measurements of global temperature from Remote Sensing Systems (RSS) dataset of global satellite tropical middle troposphere temperature (TMT). The previous version of this dataset showed less warming of the atmosphere than analysis of satellite measurements from other groups and became a favorite of climate skeptics. With new analytical methodology, this revised version shows the atmosphere warming faster.
This revised TMT dataset uses an updated methodology to correct the changes in the orbit of the satellites. This correction is necessary because the local observation time changes as satellite orbit decays over the lifetime of an instrument. If a satellite started orbiting the U.S. at 4 pm every day when it first launched, but by the end of its cycle orbited above the same point at 7 pm, then there would be an artificial cooling bias in the temperature trend for this location (and vice-versa for example, if the times were 10 am and 1 pm, a warming bias would be introduced). The different groups that analyze satellite data use their own methods for drift correction.
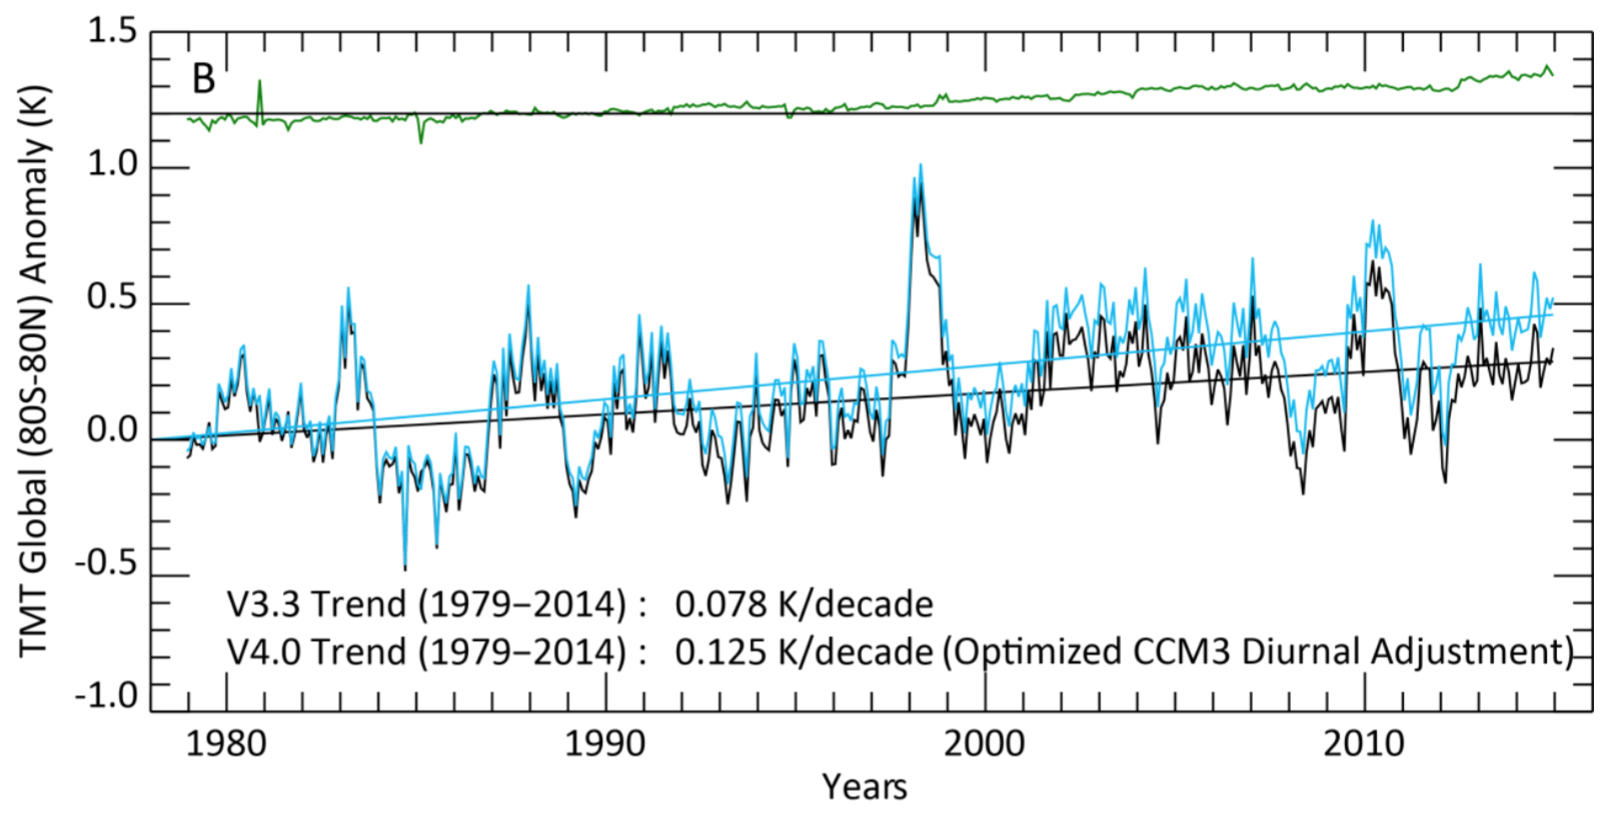
RSS uses the output of a global climate model to apply diurnal adjustments, but it was realized that the application of climate model output alone was not sufficient to eliminate the diurnal cycle bias when splicing together all the satellite data. This new work applies three different techniques to eliminate the remaining bias. All three techniques result in an increased warming trend since the start of the satellite record. The figure below, from the paper, illustrates the new v4 time series (blue line) and the difference between the old RSS (v3.3) and the latest version (green line).
Figure 1: Global TMT temperature records from RSS. Source: Mears and Wentz, 2016
The 1979-2014 trend rate is 60% greater in RSSv4 than RSSv3.3. When the data is updated to the end of 2015 and includes the influence of the current El Niño, this trend will almost certainly be even higher.
In comparison to the other analyses published of satellite data, the RSS temperature estimates now show the fastest rate of warming since 1979 (0.125 K / decade, compared to 0.052 K/dec from UAHv5.6 and 0.103 K/dec from STAR).
Why is this noteworthy?
Some have already insinuated that this revision was made with the goal of finding warming. But it is doubtful that diurnal adjustment optimization is a matter of political preference. And if satellite measurements are so vulnerable to the subjective preferences of the principle researchers, how is that consistent with the notion—often forwarded by climate skeptics—that satellite data is the best data we have?
The methodological changes behind this new RSS dataset apparently resolve some known deficiencies with how the previous version handled adjustments for diurnal drift. Further inquiry and analysis will show us how well these particular adjustments hold up against independent data and review.
We’ve previously written about the divergence between satellite temperatures and climate model simulations (for that matter, so has Mears, repeatedly). That divergence is often cited as evidence that climate models and their predictions are overheated. The upward revision of warming rate in this new dataset will not resolve that divergence, which means that these errors in the satellite data are not behind that divergence. Unknown errors would have to be substantial to cover the gap. Instead physical factors like the internal variability of the climate, errors in the design of those simulations, and errors in the climate models are the most likely explanations for the difference.


