Washington, D.C., offers a rare opportunity to study how police departments throughout the country might, and in fact must, do more with less. Since reaching a dramatic peak in 2023, violent and property crime in the District has fallen sharply — even as the police force shrank to its smallest size in half a century.
This essay draws on Metropolitan Police Department (MPD) crime and arrest data, officer deployment records, and independent data sources to explain the role police management played in that paradox and extract lessons for American cities facing similar constraints. We argue that MPD’s improvement was driven not by headcount but by a tactical shift toward proactive, upstream enforcement — though the department left significant gains on the table by failing to concentrate that enforcement where and when crime was most severe, or to adjust dynamically as crime patterns shifted. We also examine the August 2025 National Guard deployment, which added roughly 2,000 uniformed personnel to D.C.’s streets virtually overnight, and find that it produced a real but narrow improvement: a 24 percent reduction in opportunistic property crime in the first six months, with no measurable effect on violent crime. A cost-benefit comparison shows that an equivalent investment in targeted, data-driven MPD deployment might produce social benefits an order of magnitude larger. The central finding across all three analyses is the same: What determines the effectiveness of police is not merely how many officers a city employs, but where they are, when they are there, and what they are doing.
Introduction
National crime rates are receiving enormous attention again, and this time it’s for happy reasons. Since 2023, most categories of crime have fallen sharply. Homicide and auto-related crimes, which spread fear in American cities in the early postpandemic years, have seen the steepest declines. According to the Council on Criminal Justice (CCJ), homicides fell 21 percent between 2024 and 2025, approaching the lowest rate in 125 years. Gun assaults dropped 22 percent, and carjackings plummeted 43 percent (CCJ, 2026). Taken together, violent crime is now lower than it was before the pandemic.
There are many competing explanations for this decline. Establishment Democrats credit Biden-era social spending, particularly the American Rescue Plan Act, the nearly $2 trillion federal stimulus that buoyed state and local governments, including public safety agencies (Peters & Wolley, 2024). Progressives point to a drop in police capacity, and argue that communities tried new strategies focused on violence prevention (Fowler, 2025). Republicans favor the influx of federal law enforcement and immigration authorities into predominantly blue cities (The White House, 2026). All these explanations are, to varying degrees, inconclusive: They force us to work backward through a tangle of potential causal pathways without the ability to isolate any specific policy changes. You can celebrate fewer people dying and getting hurt even without knowing exactly why, but if we want to learn something from the improvement, we need to approach the data more carefully.
A better approach is to zoom in. Rather than attempt to explain a national trend from the top down, it is more productive to examine a single city, unpack the changes that occurred there, and see which theories of change, if any, hold up to scrutiny. In this essay we are interested in the effects different police strategies had on crime. We understand that other factors may also have affected crime rates, and though we do our best to control for them, this is ultimately a story about policing. By isolating and evaluating which components had an actual impact on crime, we can stop spreading police resources thin and instead scale what works. Cities will need to do more of this in the coming years, as their ability to fund police forces and attract people to the policing profession are in peril.
Washington, D.C., is an ideal case study. For decades, the city was known as the murder capital of the nation, with a peak yearly homicide rate of 80 per 100,000 in the early 1990s (Asher, 2025), nearly eight times the highest national rate (Brennan Center for Justice, 2017). Historically, the MPD has been among the best-funded municipal law enforcement agencies in the country, and before the pandemic, the city’s police per capita rate was higher than in any other large American city (Third Way, 2023). Since the early period of the pandemic in 2020, crime has fluctuated dramatically, while the size of the police force has shrunk significantly and is now at its lowest level in decades. In 2025, D.C. became the site of a striking natural experiment — the deployment of approximately 2,000 National Guard personnel — that allows us to examine the relationship between law enforcement presence and crime with exceptional clarity.
We are particularly interested in two inflection points: the crime peak that began in spring 2023, when D.C.’s crime trajectory broke sharply from national trends, and the August 2025 National Guard deployment, when the city’s enforcement landscape changed almost overnight. Our analysis yields three main findings.
First, since the 2023 crime peak, MPD has become more effective despite a shrinking sworn workforce. That fact alone is instructive: It suggests that raw headcount is not the key margin for public safety. We find that between 2022 and 2025, the composition of arrests changed substantially given a shift toward proactive, upstream enforcement (e.g., narcotics sweeps, traffic interdictions, warrant executions) even as reactive-arrest categories barely moved. Clearance rates also improved. Fewer officers, deployed more deliberately, were doing a different kind of policing, and the evidence suggests it was working.
Second, we find that the National Guard deployment produced an additional measurable reduction in crime of approximately 24 percent, concentrated almost entirely in opportunistic property crimes. The Guard was not a substitute for MPD: Guard members had no power to arrest, operated largely independently, and were placed mostly in highly visible commercial, transit, and tourist areas rather than high-crime neighborhoods (U.S. Senate Committee on Homeland Security and Governmental Affairs, 2026). We find that MPD’s deployment patterns didn’t change in response to the Guard’s presence, so it is unlikely that strategic coordination occurred, and discussions with current and former personnel confirmed this. What the Guard brought was a massive, sudden shock from the visible presence of uniformed military personnel on the streets of Washington almost overnight. For crimes driven by opportunistic calculation, that visibility appears to have mattered. For violent crime, which is less deterrable by patrol presence alone, it did not.
Third, while the Guard’s deployment reduced the occurrence of specific crimes, it was (and remains) a blunt and expensive instrument. Our cost-benefit analysis demonstrates that a targeted, data-driven policing strategy optimized on where and when crime actually occurs could achieve comparable or better outcomes at a fraction of the cost.
The central throughline across all three findings is the same: What matters in policing is not how many officers a city employs, but where and when they are visible and what they are doing. Strategy, not headcount, is the operative variable.
What happened to crime in Washington, D.C.?
A bird’s-eye view: D.C. vs. the nation
Figure 1 provides a bird’s-eye view of crime in Washington, D.C., over the past eight years, plotting total reported incidents per 100,000 residents alongside the national average.
From 2018 through 2022, the two series tracked one another closely. D.C., like most large cities, consistently shows higher absolute crime rates than a national average that includes usually low-crime suburban and rural areas — roughly 60 percent higher across most of the period. Both series dipped in 2020, recovered through 2021, and remained roughly aligned through 2022.
Figure 1. Bird’s-eye view: Total crime incidents per 100,000 residents, D.C. vs. national average, 2018–2025.
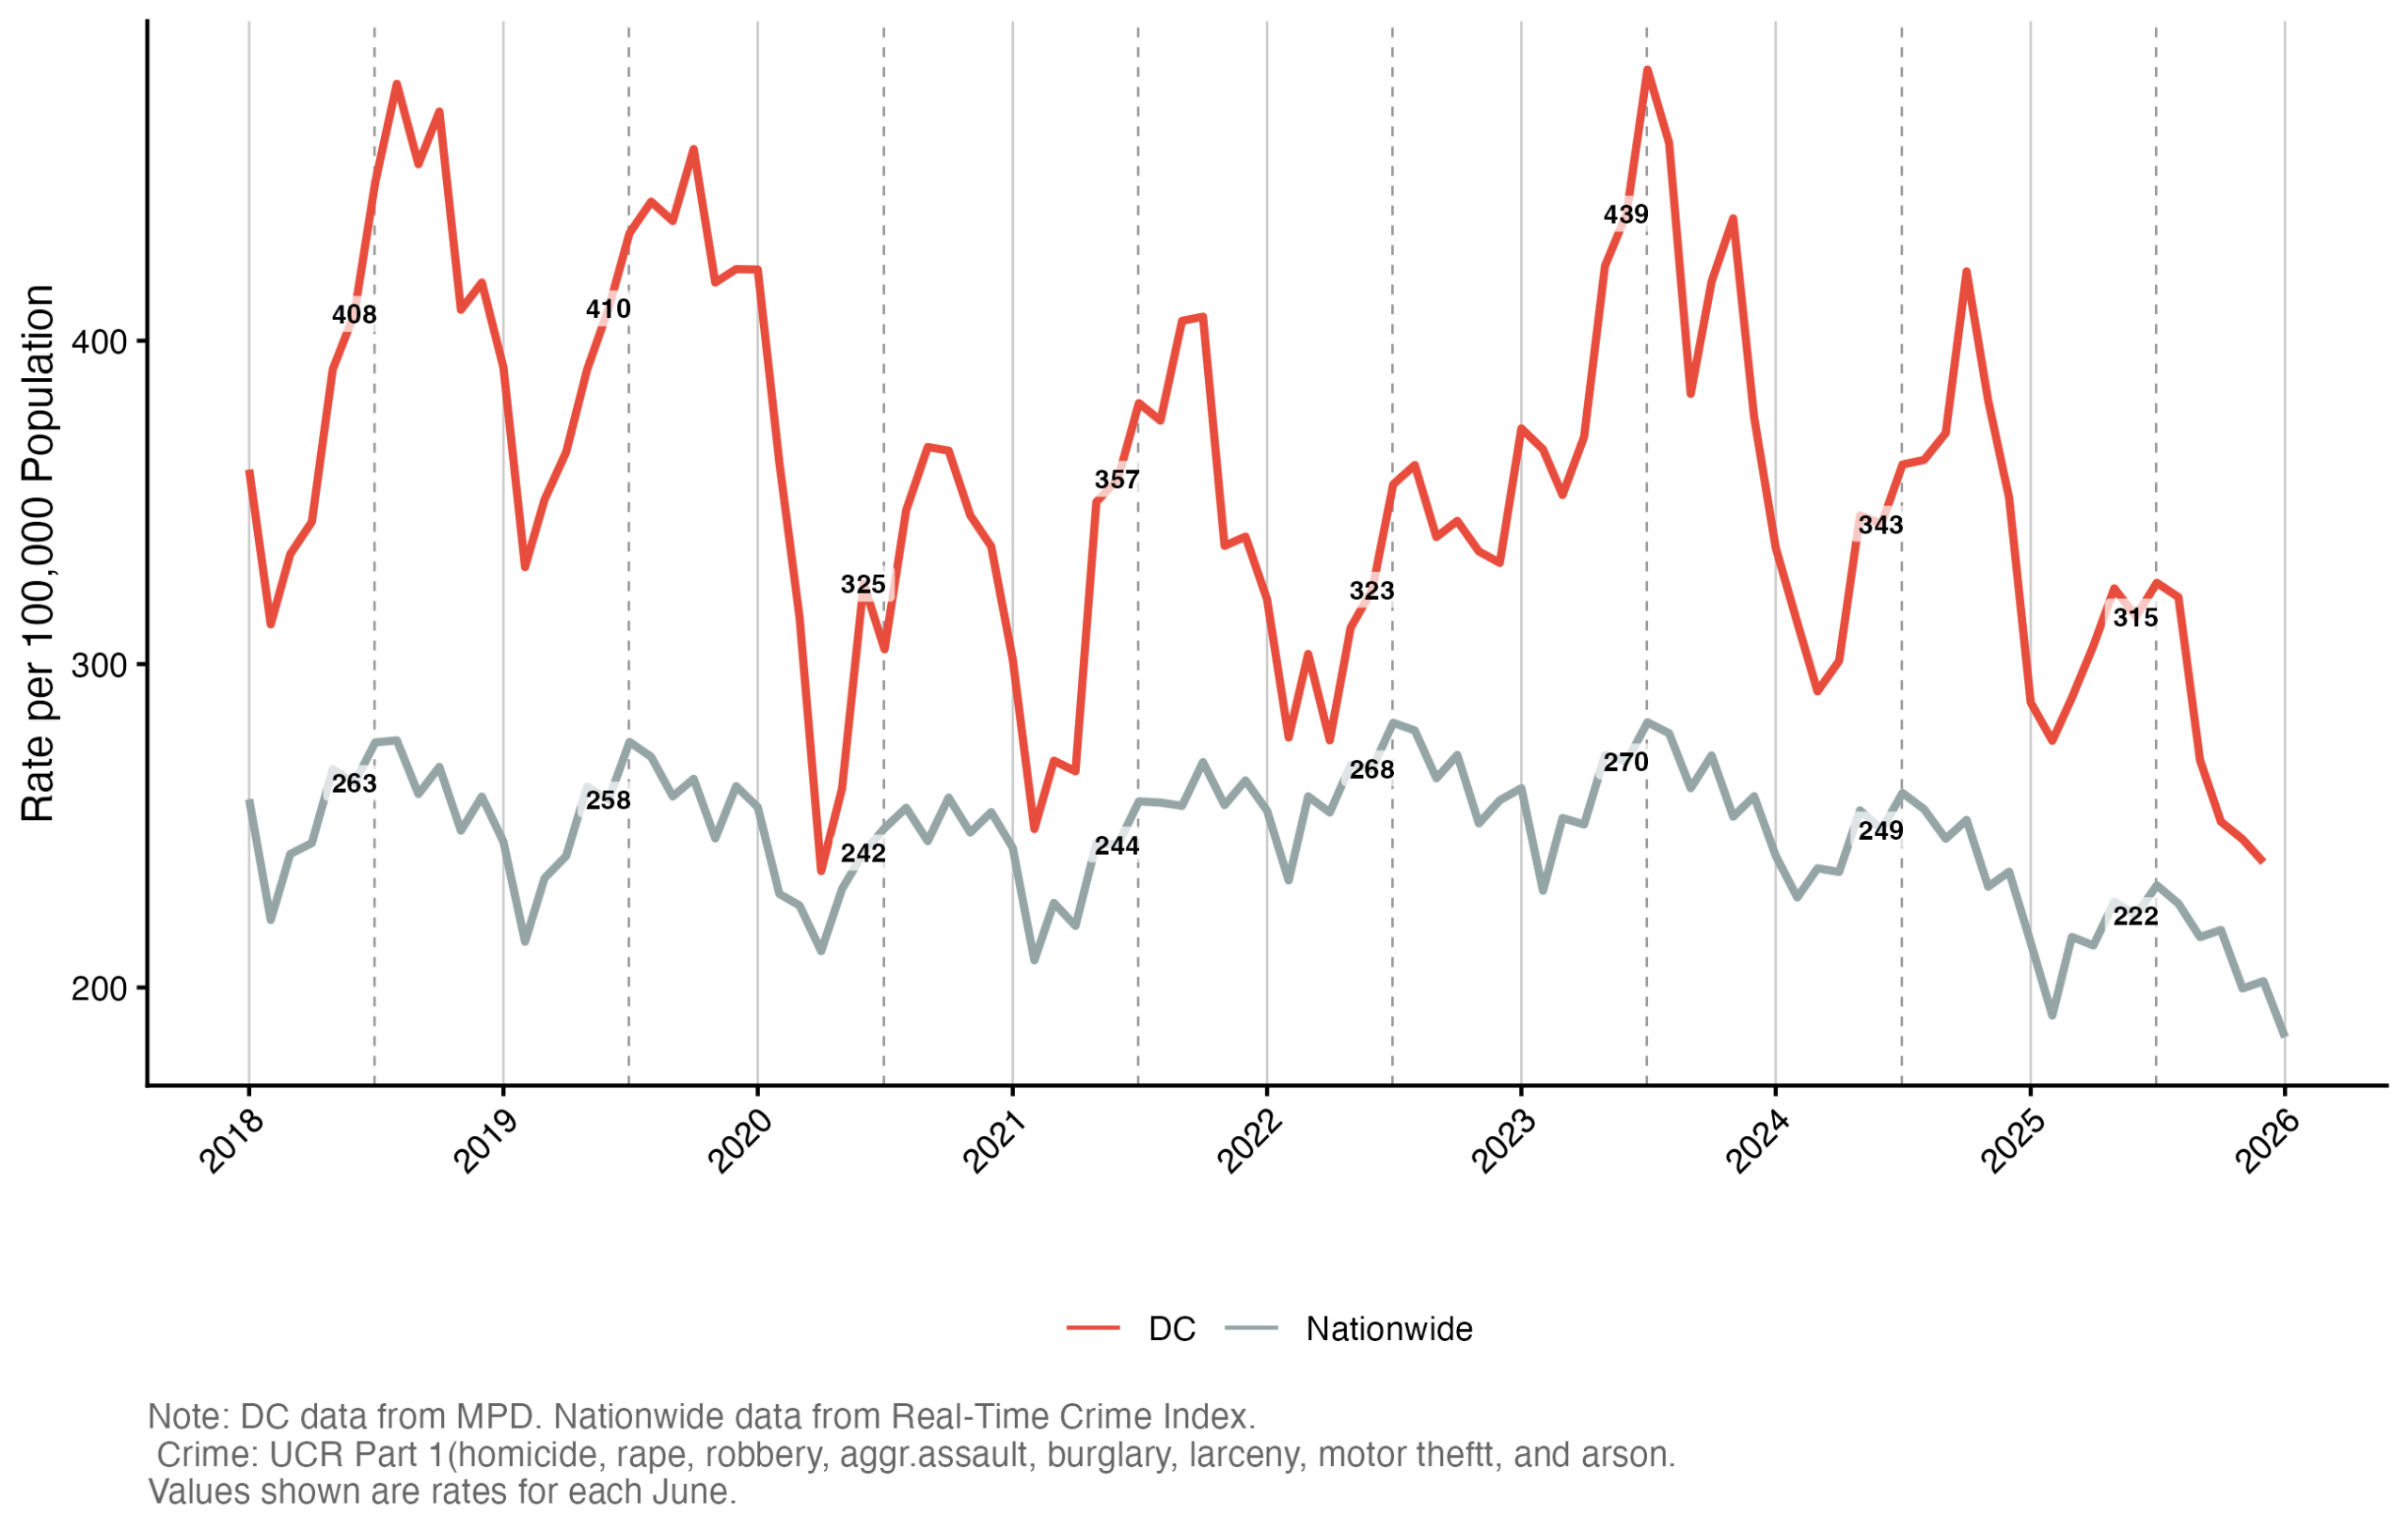
What makes D.C.’s recent experience distinctive is what happened next. Starting in 2023, its series diverged sharply from the nation’s: Even as crime was high nationally — a postpandemic phenomenon — D.C. broke away dramatically, reaching a peak of 484 incidents per 100,000 in July 2023. Since then, the trajectory has reversed with equal drama. By early 2026, D.C.’s rate had fallen back toward the national average, a convergence that would have seemed unlikely just three years ago. Benchmarking against the nation helps isolate what is D.C.-specific.
Two crime waves, not one
Disaggregating the numbers by crime type reveals that the 2023 surge was not a single phenomenon but two distinct epidemics unfolding simultaneously across different parts of the city (Figure 2). Understanding their separate dynamics is essential for understanding both what went wrong and what turned it around.
Figure 2. D.C. vs. national crime rates by category, 2018–2025.

The first wave was geographically diffuse and centered on cars. Motor vehicle theft and carjacking spread broadly across D.C., particularly along commercial corridors and transportation routes, in ways that had little to do with the existing geography of other serious crimes. Washington’s spike was exceptional even by national standards: According to the National Insurance Crime Bureau, the District saw a year-over-year increase in vehicle theft twice as large as any state with the exception of Maryland, leading the nation in per-capita thefts (NICB, 2023). This boom was driven partly by viral social media trends (e.g., the Kia Challenge on TikTok) and partly by postpandemic spikes in used car values that raised the street-level incentive for theft (NICB, nd; Cox Automotive, 2023). Auto related crimes diffused widely, given these conditions, because cars are everywhere.
The second wave consisted of murder and robbery. While most American cities experienced a pandemic-era homicide shock that peaked around 2020–2021, Washington’s came later and hit harder. Monthly murders continued to increase through the pandemic and then exploded in the summer of 2023, reaching a rate more than four times the national average. Robberies followed a similar arc, spiking to roughly 67 per 100,000 residents in July 2023, about five times the national rate of 12, before declining steeply through 2024–2025. A portion of the robbery surge likely reflects a classification overlap: carjacking is often coded as robbery for FBI reporting purposes but separately in local MPD records, and the spikes in robbery and motor vehicle theft occurred at roughly the same time.
Nonauto property crime is the stubbornly persistent element of D.C.’s crime landscape. Unlike the sharp spike and-recovery pattern of auto theft and robbery, D.C.’s nonauto property crime rate, while lower than prepandemic levels, has changed little since 2020, while the national trend has drifted gently downward. This category lacks drama but its persistence makes it a significant component of D.C.’s overall crime burden.
The reversal
By late 2025, the improvement across crime categories was dramatic. Auto thefts have plummeted from their 2023 peak, now approaching national levels. Murders have fallen by nearly half since 2023, though levels remain somewhat above the national average, running around 1 per 100,000 by the end of 2025 versus roughly 0.5–0.7 nationally, a gap that has narrowed considerably from 2023’s peak of 4.4 per 100,000. Robberies have declined toward their prepandemic range. Across virtually every category, D.C. is returning to where it was before the pandemic, if not lower.
The decline shows up beyond reported crime as well. Acoustic gunshot detections from the city’s ShotSpotter sensor network, an independent record of when guns are fired, regardless of whether anyone calls police, fell sharply over the same window and reached their lowest levels in years by late 2025. We return to this interesting piece of evidence below.
The improvement in citywide averages conceals important geographic asymmetry, which is crucial to drawing a policy interpretation from changes in both crime and policing. Figure 3 shows two D.C.’s side by side.
Figure 3 (left). Average monthly crime exposure by census block, 2023 peak.
Figure 3 (right). Change in crime exposure per block, 2023–2025.
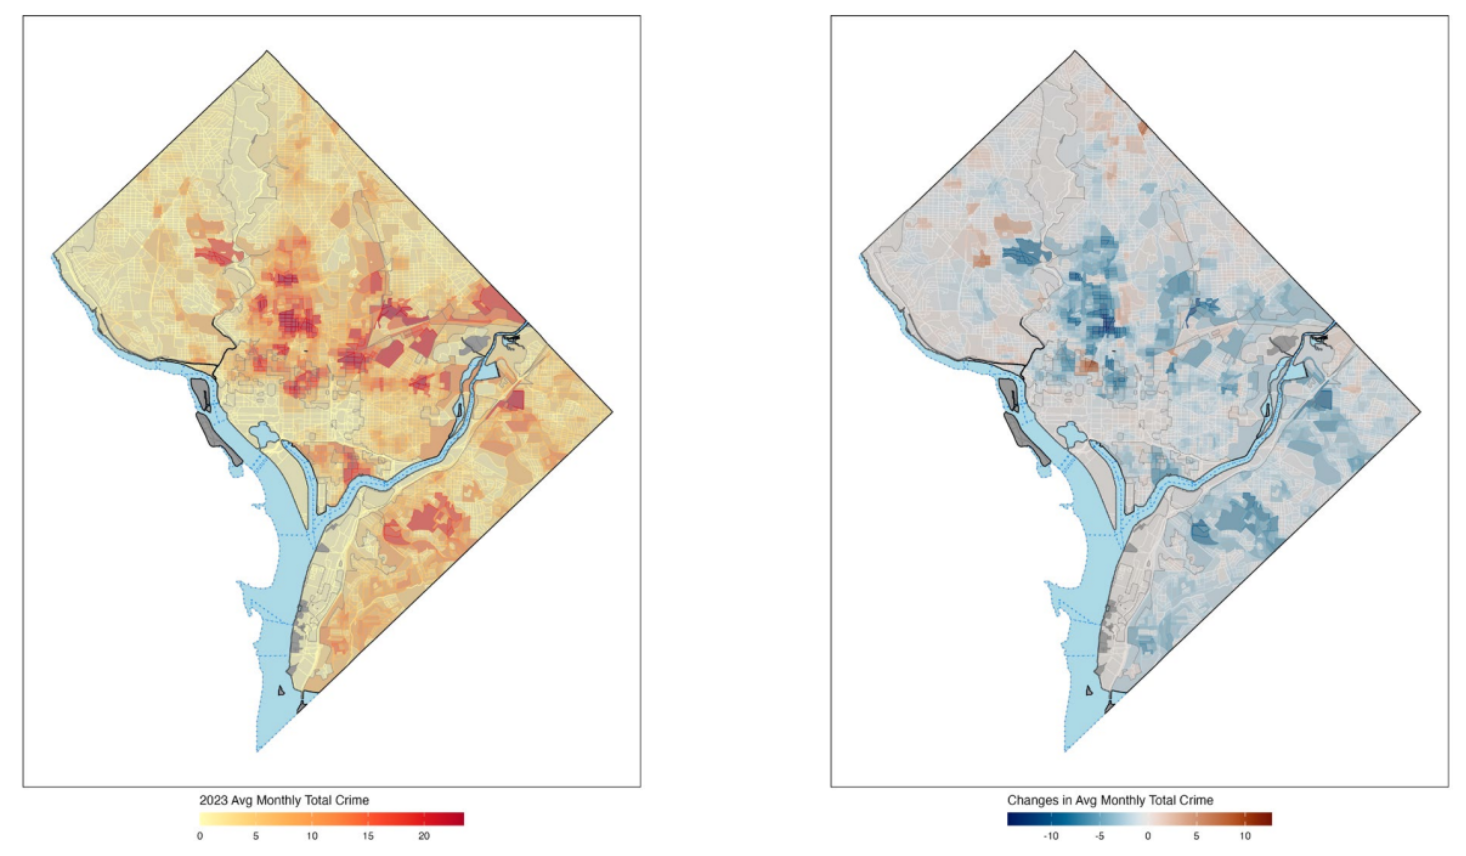
Note: Crime exposure is constructed by summing all incidents within a quarter-mile of a census block that share its geographic landgroup, applying a flat-top exponential decay function so that immediate crimes receive full weight while the influence of more distant incidents is mathematically discounted.
We construct a block-by-block measure of crime exposure by adding up nearby incidents, giving more weight to crimes that happen closer to a block and less weight to those farther away. Crimes within a block and right next to it count fully, while their influence gradually fades with distance. The left panel plots average monthly exposure in 2023, the peak year. The pattern is stark: a corridor of deep red running through the center and east of the city, while the northwest quadrant and other large pockets throughout the city show relative calm. Crime is historically concentrated; this is not a new discovery (Cahill & Roman, 2010; The Urban Institute, 2015). In D.C., crime is entrenched in neighborhoods east of the Anacostia River, such as Buena Vista, Anacostia, and the Central Northeast, often places with parkland and other difficult-to-patrol public spaces. This crime often bleeds across the river into high-traffic areas in the southeast, such as Navy Yard. North of the central commercial corridors, Columbia Heights and Bloomingdale often have starkly higher crime rates than proximate neighborhoods separated from them by only a few blocks. The areas north and east of Union Station have also historically experienced elevated crime, and commercial development has exacerbated this. Looked at with a wide-angle lens, it is easy to predict which parts of the city will have high rates of crime year after year.
The right panel asks: Where did crime fall between 2023 and 2025? The answer is almost everywhere, but the declines are sharpest precisely where crime was highest.
The neighborhoods that bore the brunt of the 2023 spike, in pockets to the east of the Anacostia, bordering areas on the west bank of the river, north of the central city, and to the northeast of Union Station, are the same ones that have seen the largest absolute reductions since. The geography of the crime wave and its unwinding are mirror images. The numbers make this concrete: Our calculations from the underlying data in Figure 3 show that the average block in D.C. experienced a crime exposure level of approximately 3.50 incidents during 2023; by 2025, that figure had fallen to roughly 2.49, a reduction of nearly 30 percent, concentrated in the neighborhoods that needed it most.
Because high-crime neighborhoods are generally more densely populated, the share of residents still exposed to persistently elevated violence is likely larger than that land-area figure implies. This matters for an equity reason as well as a safety one. Recent evidence (Knorre & MacDonald, 2026) suggests that the Black–White racial disparity in firearm homicides, which account for the overwhelming majority of homicides, has grown since the 2010s. Given that the neighborhoods where violent crime remains most persistent are disproportionately communities of color, the persistence of localized violence is not just a policing problem, it is a civil rights issue.
The Puzzle: Fewer Officers, Less Crime
A shrinking force
The decline in crime since 2023 coincides with a striking reduction in the MPD workforce.
The available statistics (MPD, 2026; Hermann, 2026) show that MPD total workforce reduced from around 4,000 officers in 2013 to 3,350 by 2023, and has since dropped further to 3,144 as of early 2026, representing a loss of more than 660 officers compared with prepandemic staffing levels. But the official count of officers belies the true effective size of MPD. The number of sworn officers — the police who carry a badge and gun and have the power to arrest people — has fallen even faster, and approximately 14 percent of the force is now tied to a desk rather than in the field. Figure 4 traces the depletion in three waves: In mid-2018, the average number of sworn officers available for patrol duty was around 1,800, and this remained relatively stable until 2021. Then the sworn count dropped sharply until mid-2024, at which point the headcount stabilized around 1,300. In other words, almost a third of the District of Columbia’s effective patrol force fell off the roll, most of them between 2021-2024.
Figure 4. Sworn officer counts and crime, 2018–2025.
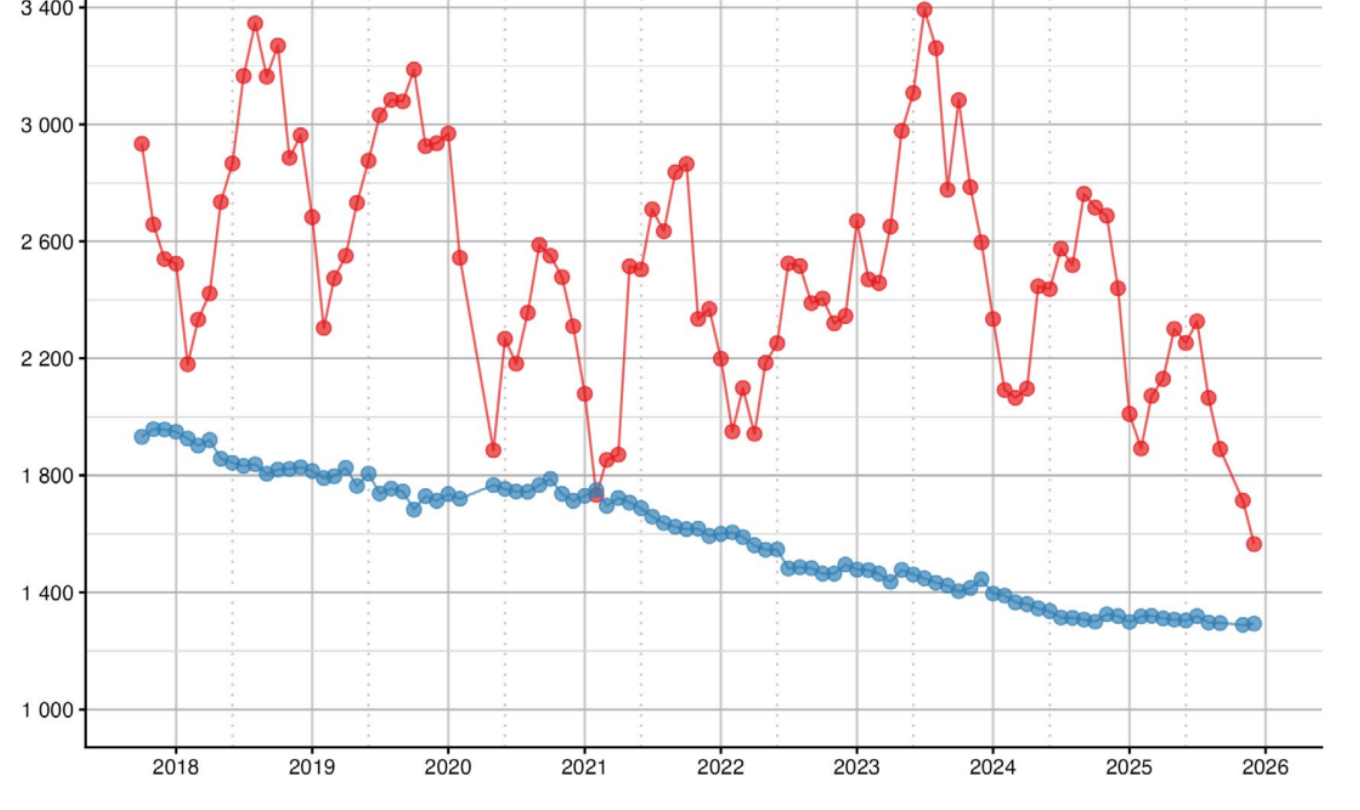
The causes of this decline are well documented. Following the death of George Floyd, the D.C. Council cut MPD’s budget by $15 million in response to calls, in the District as throughout the country, to defund the police, and initiated a hiring freeze. These measures exacerbated a trend that also is not unique to D.C.: a steady decline in law enforcement personnel nationwide due to depressed recruitment, career changes among officers, and a demographic cliff, as officers hired during crime’s boom years in the 1980s and ’90s approached retirement. In D.C., departures have outpaced hiring for seven consecutive years. Even a $25,000 hiring bonus, a 13 percent pay increase, and other significant financial inducements have done little to stanch the flow. The department has plugged the gaps with overtime — to the tune of $130 million in the most recent fiscal year alone, about a quarter of MPD’s total budget (Washington Post, 2026).
Here is the puzzle: Crime in D.C. fell sharply after 2023, just as the number of sworn officers hit a half-century low. As the city shed officers between 2021-2024, crime surged and then receded, without any corresponding recovery in police staffing. The causal arrow is unlikely to run in the direction from falling crime to reduced police if nothing else changes: Cities do not lay off officers just because crime drops, and the staffing decline reflects budget decisions and long-running attrition that predate recent crime trends, sometimes by years. And we are not claiming that crime is unresponsive to police force size; some portion of the 2023 crime spike is almost certainly explained by the exodus of officers. But headcount cannot explain the recovery. Crime fell sharply between 2024 and 2025 with no corresponding rebound in officers on the street. Something else was at work. So what changed?
The geography of deployment
Allocation of police to places likely to experience high crime rates might make up for declining headcounts. It is well understood in the literature (Weisburd, 2015) that crime is highly spatially concentrated, and it is highly concentrated within D.C. as well (Cahill & Roman, 2010; The Urban Institute, 2015). So the case for thinking carefully about where officers are deployed and how they move about during their shifts, always a fundamental matter, is particularly strong in this context. Because hotspots shift subtly over time and in response to police deployment, MPD, like all police agencies, would be wise to frequently interrogate whether its distributions are efficient relative to the distribution of crime and tweak them in response.
Was this what happened in the District? Perhaps not.
Figure 5 mirrors the layout of Figure 3, showing a measure of block exposure to officer deployment in 2023, alongside deployment changes since then. The left panel shows that officer deployment correlates geographically with crime, but not in the same way across neighborhoods. For example, deployment in the left-panel is more densely concentrated east of the Anacostia River in general, but not just in areas where crime is highest. Rather, highly policed blocks are spread throughout the area, even in neighborhoods with relatively little crime, such as Dupont Park and Shipley Terrace. West of the Anacostia, officers are often concentrated near park spaces that border affluent areas.
Figure 5. Sworn officer exposure by census block, 2023 (left) and change in officer presence 2023–2025 (right).
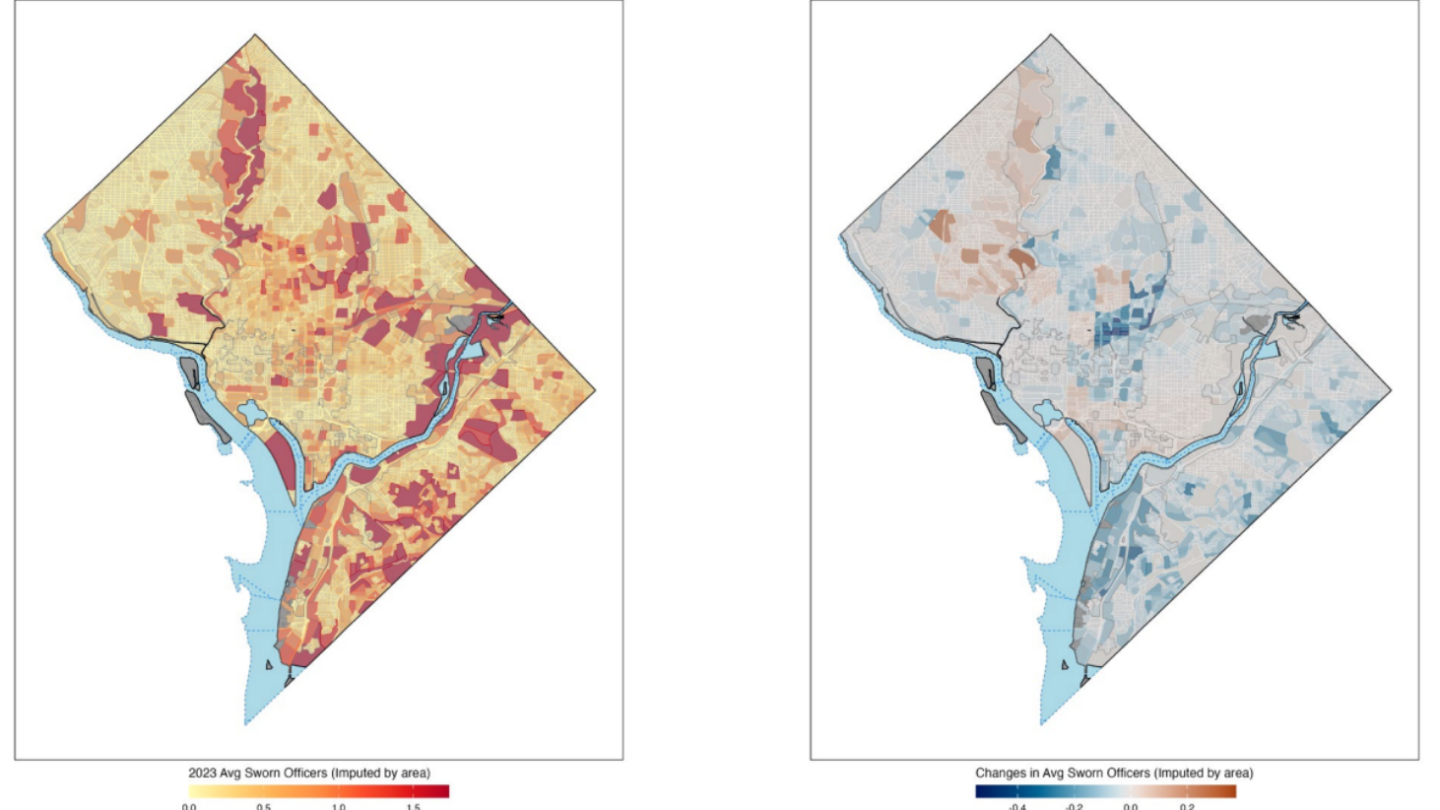
Note: Crime exposure is constructed by summing all incidents within a quarter-mile of a census block that share its geographic landgroup, applying a flat-top exponential decay function so that immediate crimes receive full weight while the influence of more distant incidents is mathematically discounted.
Between 2023 and 2025, sworn officer presence fell across most of the city, but not evenly (right panel). The deepest reductions landed in many of the same neighborhoods that had seen the sharpest crime spikes: the corridors east of the Anacostia, the H Street nightlife corridor, and the central-city hotspots that burn red in Figure 3. Meanwhile, the northwest — D.C.’s safest quadrant — held its officer counts or increased them. The city did not redeploy a shrinking force toward its most dangerous neighborhoods. It pulled back from them. And yet crime fell anyway.
That paradox reframes the policy question entirely.
If crime can fall while officer counts are declining, and while officers are being pulled back from the highest crime neighborhoods, then headcount is not what is doing the work. What matters is how those officers are used: whether they are in the places where crime actually clusters, at the times when it peaks, and whether their energy is concentrated on focused enforcement rather than spread thin across routine patrols. Headcount is what gets debated in budget hearings. Presence, deployment, and strategy are what actually move crime.
MPD seems to have gotten part of this equation right — the part about what officers do — and to have left meaningful gains on the table on the part about where they do it. We develop both claims below.
The National Guard as natural experiment
Setting the scene
The evidence so far suggests that how officers are used matters more than how many there are. But to strengthen that case, we need a moment in which policing strategies change abruptly and for reasons unrelated to underlying crime trends. A moment clean enough to isolate a single cause, a change in total number of uniformed bodies on the street.
The causal channel we want to isolate is visible uniformed presence: boots on the ground, impossible for potential offenders to miss.
In the first week of August 2025, the federal government deployed National Guard troops across Washington, D.C. Approximately 2,000 additional uniformed personnel appeared on the streets virtually overnight (U.S. Senate Committee on Homeland Security and Governmental Affairs, 2026), well above MPD’s entire active sworn officer count of roughly 1,200 at the time (see Figure 4). In a city that had spent seven years bleeding officers, the Guard more than doubled the visible uniformed presence in a single week. If visible presence deters crime, this was the test.
But the Guard’s footprint was unlike standard policing in almost every respect. It was not concentrated in high-crime hotspots (U.S. Senate Committee on Homeland Security and Governmental Affairs, 2026). It did not follow MPD’s existing deployment patterns. Instead, Guard personnel were spread across tourist corridors, transit hubs such as Union Station, federal buildings, monuments, parks, and public spaces. They were often armed and could detain individuals, but they had no power to arrest; police retained that authority. Their duties extended well beyond patrol: traffic control, infrastructure security, clearing homeless encampments, and what internal documents describe as “beautification” work (U.S. Senate Committee on Homeland Security and Governmental Affairs, 2026).
In other words, this was not hotspot policing. It was not even conventional policing. It was a large, sudden, and independently operated surge in uniformed presence, uninformed by crime data and concentrated instead in the spaces where the public life of the city happens.
A break in the pattern
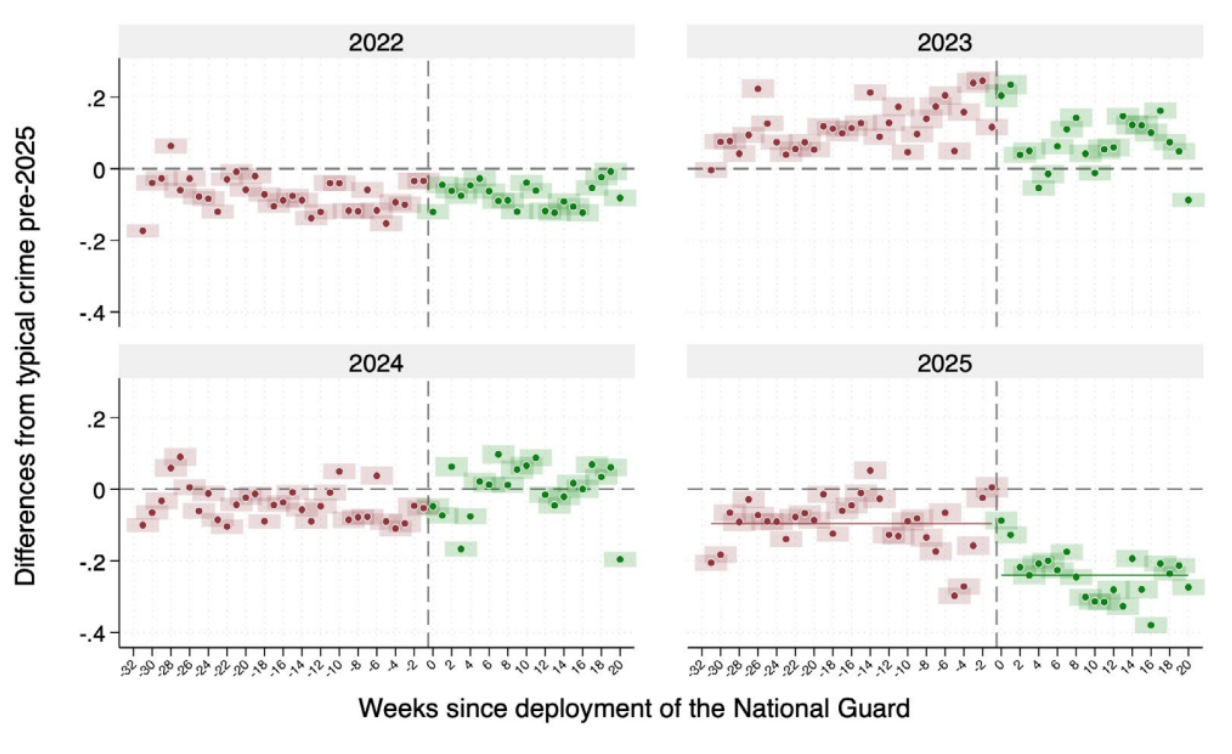
What happened after the Guard arrived? Figure 6 looks at crime from a different angle. Rather than tracking aggregate trends over time, it shows the deployment’s impact using an event-study framework around the first week of August 2025.
Each of the four panels in the figure plots weekly crime deviations from a typical baseline — defined as the block by-week average over 2022–2024 — separately for each year from 2022 to 2025. The horizontal axis counts weeks before and after the deployment date; the vertical axis measures how far crime in a given week departs from what is typical for that block in that week of the year.
This within-block, within-week-of-year demeaning is worth pausing on. Demeaning simply means subtracting the mean — in this case, subtracting each block’s typical crime for each calendar week, so that what remains is the deviation from that block’s own norm. By doing so, the figure strips out both the fixed characteristics of neighborhoods — their permanent crime levels, what economists call neighborhood fixed effects — and the seasonal rhythms that drive crime up in summer and down in winter. What remains is the residual: crime running hotter or colder than usual, for that block, at that time of year. This is why the series in the figure are relatively flat compared with the seasonal patterns in Figures 1 and 2: The predictable components have been removed, and what we see is genuine deviation from the norm.
It is precisely those deviations — stripped of season, stripped of neighborhood fixed effects — that carry the causal signal (see endnote).
Of course, the National Guard has been deployed only since 2025. Thus, the first three panels (2022, 2023, and 2024) serve as placebos. If the figure is well constructed to corroborate our causal reasoning, we should see no systematic break around August in those years; any change would reflect other factors, not a deployment that had not yet happened. And indeed, the placebo panels largely behave: no discontinuity or meaningful break around August in any prior year.
Then comes 2025. Crime was already running below baseline before the deployment — roughly 0.10 fewer incidents weekly per block below the typical figure, reflecting the broader decline in crime already underway. The Guard’s arrival accelerates it. In the weeks immediately following the deployment, crime drops sharply and stays down, settling at around 0.24 incidents below baseline for the remainder of the year. This is not a temporary spike, it is a persistent shift in level. The gap between pre- and postdeployment averages is 0.14 incidents at the block-week level. Relative to the 2025 average of 0.60 incidents, which we can back out from our discussion of Figure 3, this represents a reduction of approximately 24 percent. The 2025 panel stands apart from every other year in the figure. The break falls precisely at the deployment date.
Figure 6. Crime deviations from baseline, by year (2022–2025). The 2022–2024 panels serve as placebos; the 2025 panel shows the effect of the National Guard deployment.
What kind of crime fell — and why
The aggregate 24 percent figure raises an important question about what kinds of crime the Guard’s arrival seemed to reduce. Figure 7 shows the same event study, only for the 2025 panel, broken down by crime type.
Figure 7. Crime deviations from baseline by crime type, 2025. The property crime panels (auto-related, NE; nonauto property, SW) show a sharp break at the deployment date. The violent crime panels (robbery, NW; other violent, SE) do not.
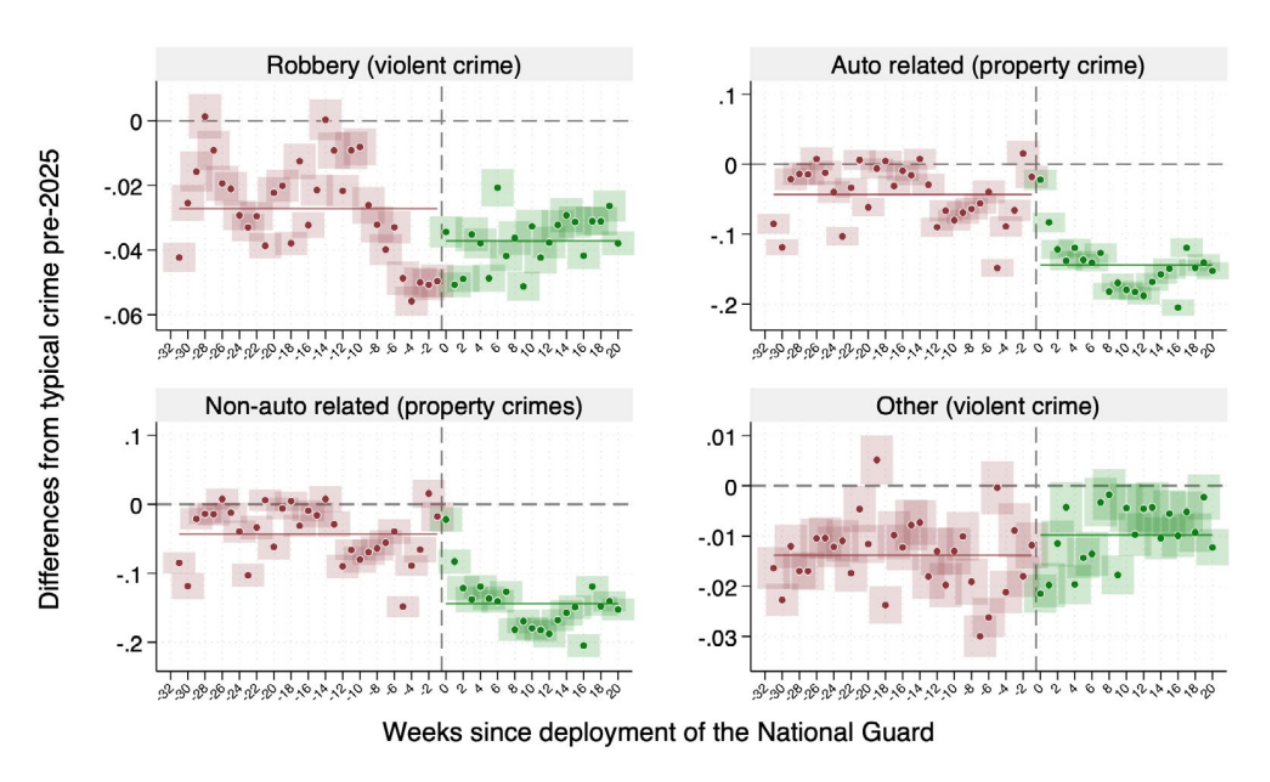
Auto-related property crime tells the clearest story. In the weeks before the Guard’s deployment, D.C.’s auto theft rate was running right at its 2022–2024 norm without any evidence of an anticipatory change. Then, immediately after the deployment, it drops sharply and stays there. Nonauto property crime tells almost the same story. Both breaks are clean, large, and fall precisely at the deployment date.
Robbery and other violent crimes do not follow the same pattern. The robbery panel displays a preexisting downward trend that predates the deployment — part of the broader 2025 improvement visible throughout D.C.’s data — but with no visible break in August, and a mean reversal pattern after then. Other violent crimes barely register a discontinuity at all.
Criminological theories of crime and place help us interpret this pattern (National Academies, 2018). The National Guard was deployed primarily in high-visibility public spaces, exactly the locations where opportunistic property crime tends to occur and where visible deterrence is most likely to be effective. Violent crime is more deeply rooted in interpersonal dynamics, social network conflicts, and the structural conditions of high-poverty neighborhoods (Sampson et al., 1997). A uniformed presence in tourist corridors and transit hubs is unlikely to interrupt a dispute between individuals with preexisting ties on their own turf. The Guard’s footprint was simply misaligned with the geography of violence.
The implication is sharp. The National Guard deployment appears to have deterred opportunistic property offending, exactly the category of crime most sensitive to visible, high-presence enforcement on the street. Violent crime was unmoved.
How did MPD react?
One obvious explanation is that MPD quietly redeployed its own officers in response to the Guard’s arrival, and that the crime decline we are attributing to visible presence was actually caused by a conventional MPD surge happening in the background. If so, Figure 7 would give the Guard credit for someone else’s work.
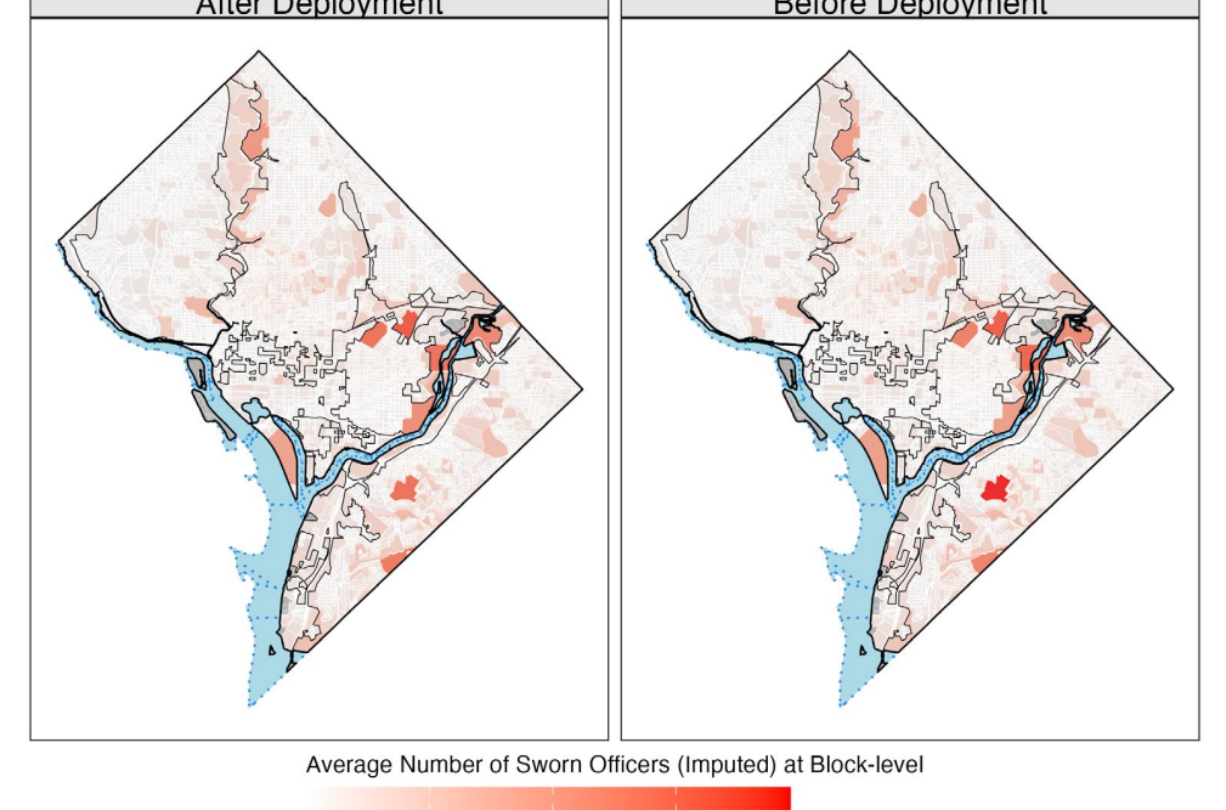
Two facts close that door, from different angles. Both aggregate officer counts (Figure 8) and block-level deployment maps (Figure 9) show no change in MPD behavior around the August deployment date: the same distribution of officers in the same locations, before and after, as if the Guard had not arrived. There is one notable exception in Figure 9 that proves the rule: policing increased inside the boundaries of Fort Dupont Park in Anacostia, a National Park Service property, and an apparent anomaly in the data. This is a single outlier in an otherwise flat picture.
Figure 8. MPD aggregate officer counts before and after the timing of National Guard deployment, with 2022–2024 data included as placebos.
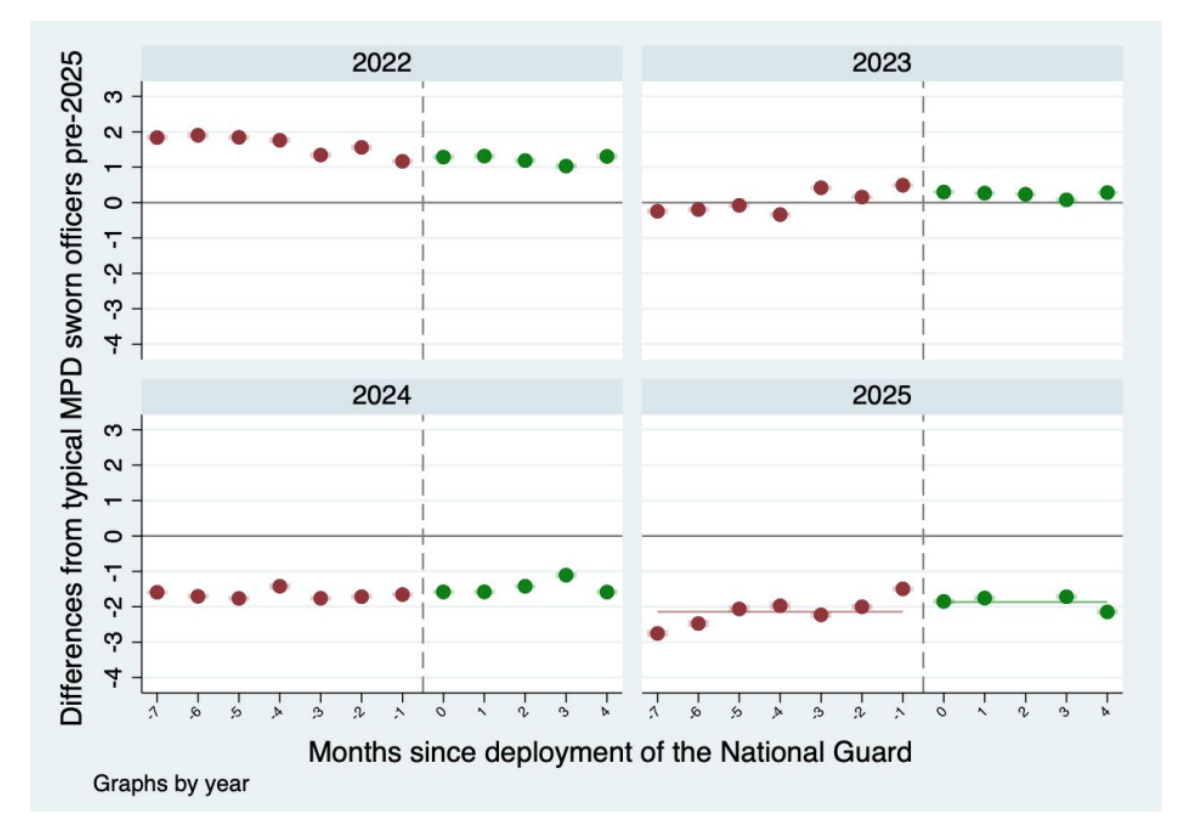
Figure 9. MPD officer presence by census block, January–July 2025 (before deployment) vs. August–December 2025 (after deployment).
So, the Guard’s arrival did not prompt a reallocation of sworn officers from MPD — not a citywide drawdown, not a consolidation, not a neighborhood-level shift. The Guard and MPD operated in parallel, with apparent independence, and the spatial footprint of MPD policing was essentially unchanged before and after August 2025.
That finding closes one door and opens two others. If MPD wasn’t redeploying in response to the Guard, the next questions are: What was MPD doing during the period immediately before the Guard deployment, and did anything other than allocation change after deployment?
To answer those questions, we turn from crime data to arrest data. The distinction matters. Reported crime reflects what happens to victims; it is shaped by offender behavior, victim reporting decisions, and circumstances outside police control. Arrest data reflect what police choose to do. When an officer makes a narcotics arrest or executes a warrant, that is a deliberate act, a signal of enforcement strategy, not just a response to whatever crosses the dispatch queue. Changes in arrest patterns are therefore a cleaner window into MPD’s operational priorities than changes in crime rates.
We sharpen this further with a proxy for enforcement effectiveness. Dividing arrests in a given period by lagged crime — arrests(t) / crime(t-1) — gives a high-frequency, aggregated approximation of clearance rates: how actively the department is converting criminal activity into enforcement outcomes. Although our measure is more coarse than the quarterly, crime-specific clearance rates MPD publishes, which count each specific clearance event, the trends we observe line up with their official statistics. We supplement this aggregate view by analyzing arrest counts separately by offense type, since the strategic logic of a narcotics sweep differs from that of a robbery response, and trends across categories may point in different directions.
Figures 10 and 11 plot monthly arrest counts and clearance rates using the same event-study framework as the crime figures, stripping out seasonal patterns in MPD allocations across neighborhoods to isolate genuine year on-year shifts.
Figure 10. Monthly arrest data, event-study framework, 2022–2025
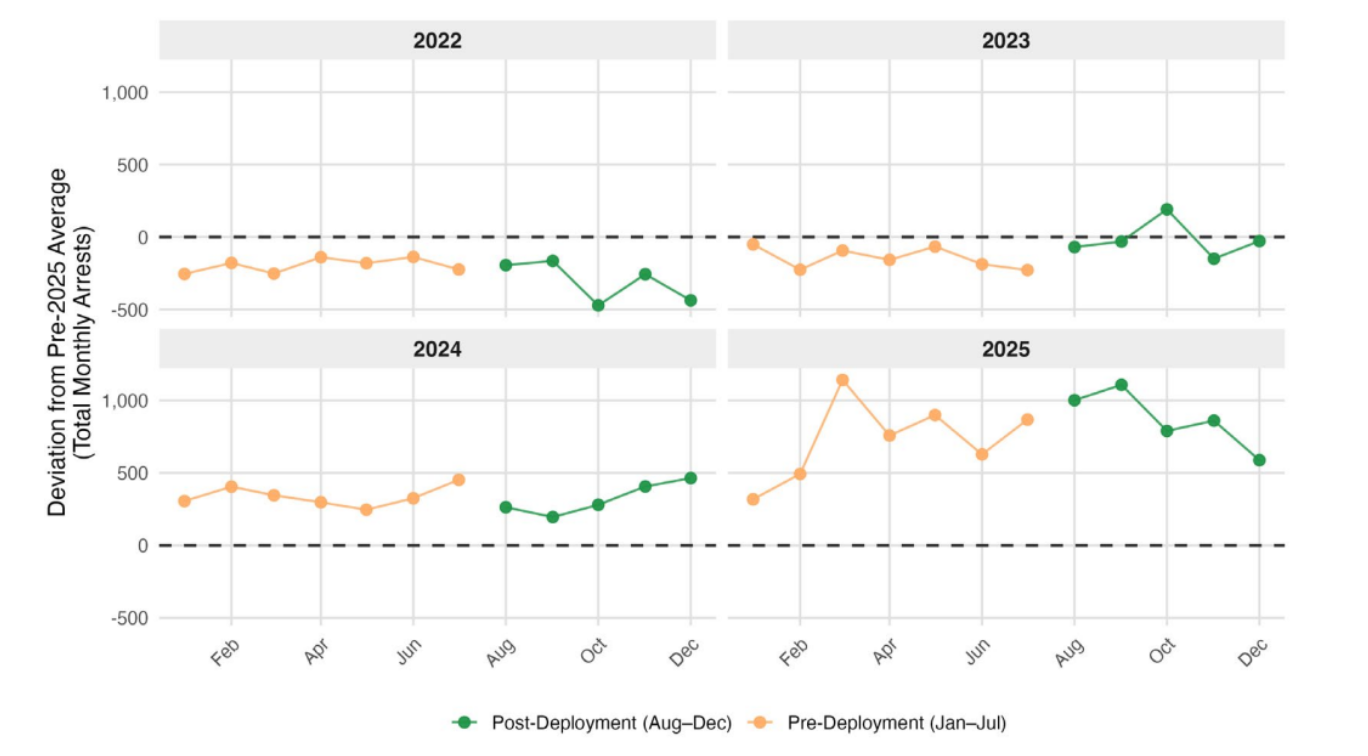
Figure 11. Monthly clearance data, event-study framework, 2022–2025
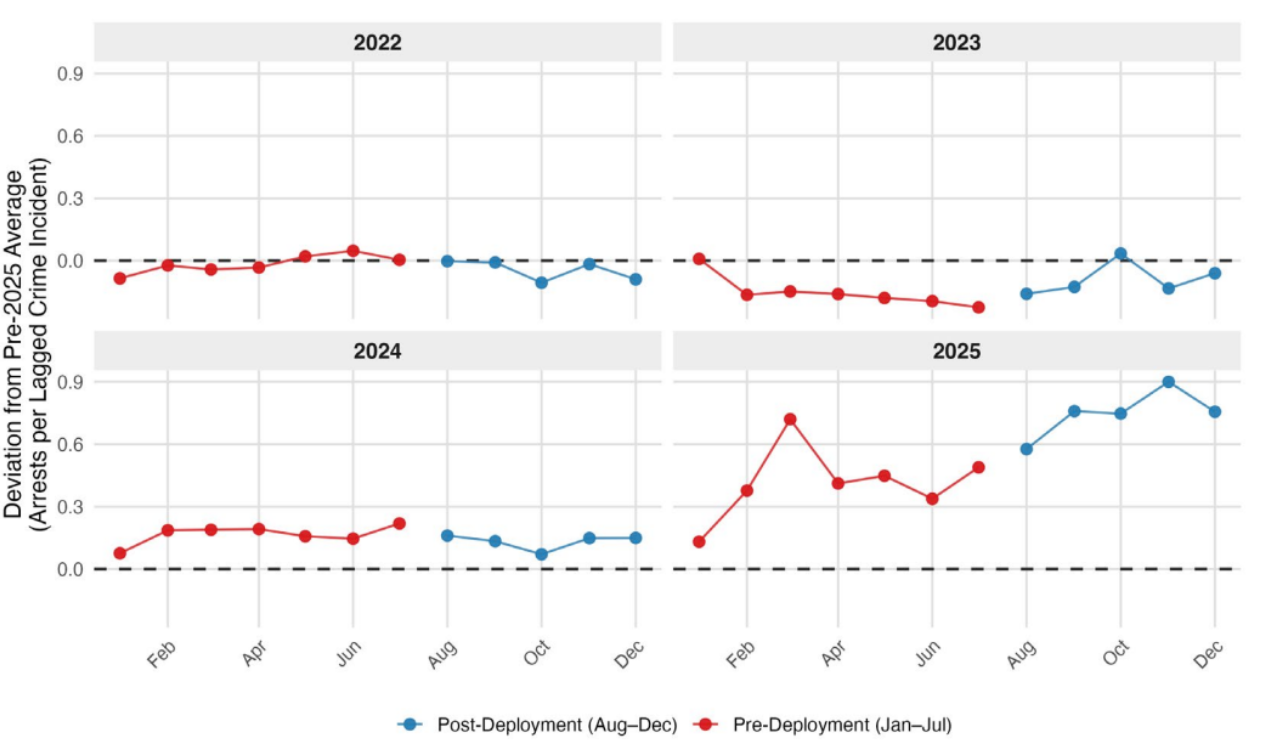
Two facts stand out from Figures 10 and 11. The first is that, since 2024, MPD was making far more arrests relative to crime. In 2022 and 2023, arrests ran close to their pre-2025 average. By 2025, they ran roughly 40 percent above it — a sustained, citywide increase in enforcement activity that is visible across offense categories and persistent across months. Fewer officers were generating substantially more enforcement output.
The second fact is that this shift in Figures 10 and 11 had nothing to do with the National Guard. In both figures, and across other event-study cuts of the data, the upward trajectory in arrests and clearance rates had begun well before August and continued straight through the deployment without a break. The Guard arrival did not accelerate or redirect the long-term improvements in MPD’s arrest statistics. MPD was already moving in that direction on its own.
That leaves a third question, one the aggregate arrest numbers cannot answer on their own. The National Guard’s effect, as we have shown, operated primarily through visibility: uniformed presence in public spaces discouraging opportunistic crime. What was MPD’s mechanism? The answer is suggested not by how many arrests were made, but by what kinds of arrests were made.
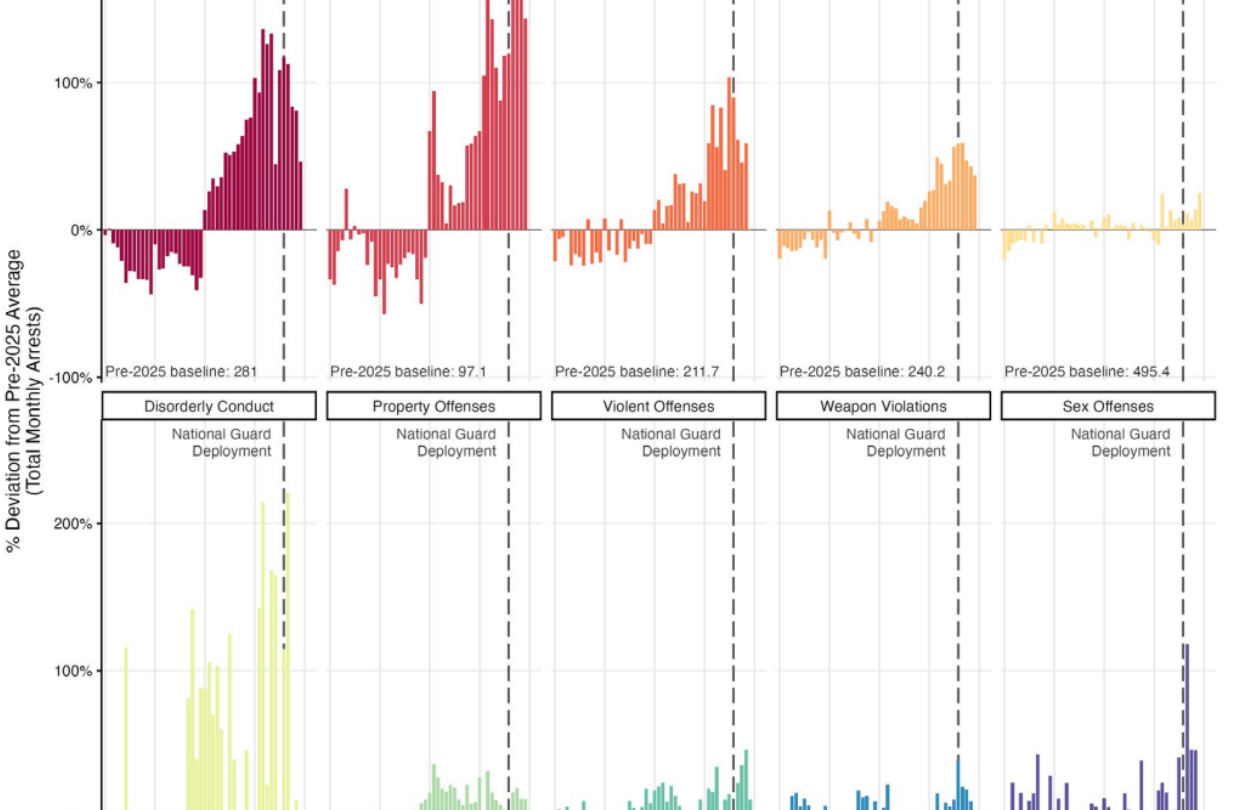
Figure 12 breaks down MPD arrests by offense type, showing percent changes from pre-2025 averages. While arrests increased in almost all panels, the rise in certain categories is much more pronounced. The categories that exploded between 2022 and 2025 are almost entirely proactive, upstream enforcement strategies: narcotics arrests (up approximately 150 percent), traffic stops and violations (up approximately 100 percent), release violations and fugitive charges (up approximately 50 percent). These are arrests that require officers to go looking for crime before it happens — stopping cars, executing warrants, sweeping for drugs and illegal weapons, pulling people with outstanding violations off the street. They signal a deliberate strategy of getting guns, drugs, and dangerous people off the street before violence happens.
Figure 12. Arrest composition by offense category, 2022–2025.
This compositional shift began in 2024 and aligns with a series of focused initiatives MPD operated during the period. Operation ATLAS (Action Teams Leaving Areas Safer) concentrated officers in nightlife corridors such as H Street, generating arrests through traffic stops, foot patrols, and on-scene interventions, while also reassuring residents and visitors that public spaces could be used safely. Operation THRIVE (Targeted Homicide Reduction Intervention and Violence Elimination) directed personnel to neighborhoods with persistent gun violence, including Rosedale, Anacostia, Washington Highlands, and Buena Vista. The Robbery Suppression Initiative (RSI) shifted deployments based on the recent geography of robberies. The Real-Time Crime Center (RTCC), which launched in 2024, integrated CCTV feeds, ShotSpotter alerts, license plate readers, and helicopter and drone footage into a single hub designed to support faster, more targeted responses. Together, these programs supplied institutional vehicles for exactly the kind of proactive, upstream enforcement that the arrest composition in Figure 12 reflects.
It is worth being precise about what these programs did and did not do. ATLAS, THRIVE, RSI, and the RTCC represent a shift along the proactivity margin — a change in what officers do when they are on shift, not where they are. Their footprint was episodic and crime-driven: An operation stood up in response to a specific surge, ran for a defined period, and stood down. What they did not do was systematically reallocate the city’s shrinking patrol capacity toward the blocks where crime exposure was persistently highest. The maps in Figure 5 make it clear that during the same window in which ATLAS and THRIVE were running, MPD’s overall spatial footprint actually thinned in several of the highest-crime corridors. The arrest data tell us that MPD got the tactical shift right. The deployment data tell us that the spatial shift was incomplete. Both can be true at once, and the gap between them is, in our reading, where the largest remaining gains sit.
The categories that barely moved are the reactive, downstream ones, in which an arrest follows a crime that has already occurred. MPD did not become substantially more effective at clearing crimes after the fact. It pivoted toward disrupting the behaviors that lead to more serious crimes. And this strategic shift did not change with the arrival of the National Guard — arrest patterns before and after August 2025 show continuity, not disruption.
Can we trust the data?
How accurate are MPD’s reported crime statistics?
A police department facing a crime spike or unwanted outside interference has incentives to cook the books and make things look better than they are. MPD faced a crime spike and federal intervention during the period we are interested in, so it’s fair to ask: Can we trust that the data to tell the real story? We believe we can.
Last fall, the House Committee on Oversight and Government Reform published a report (House Committee on Oversight and Government Reform, 2025) accusing then-MPD Chief Pamela Smith of coercing staff to manipulate reported crime figures downward through delayed reporting and misclassification, among other tactics. Chief Smith denied wrongdoing but resigned her position at the end of the year.1
These accusations matter: If crime statistics were being systematically massaged, the declines we document throughout this essay could be artifacts of administrative behavior rather than real reductions in criminal activity.
We take this threat seriously and test it directly. We show three figures examining whether MPD’s data show anomalous behavior over time and around the key events, including the National Guard deployment.
The top panel of Figure 13 shows that average reporting lags — the time in days between when a crime occurs and when it is logged by police — have fluctuated over time and across administrations, with a notable spike during the leadership transition of mid-2023. But the anomalous fluctuations are in the order of three to four days, not weeks, and no sustained compression or expansion is visible that could account for the magnitude of the post Guard-deployment crime decline we document. The bottom panel of Figure 13 confirms that reporting lags have been broadly stable throughout the period: Crimes reported more than a week after the incident are a negligible share, and that share shows no meaningful trend.
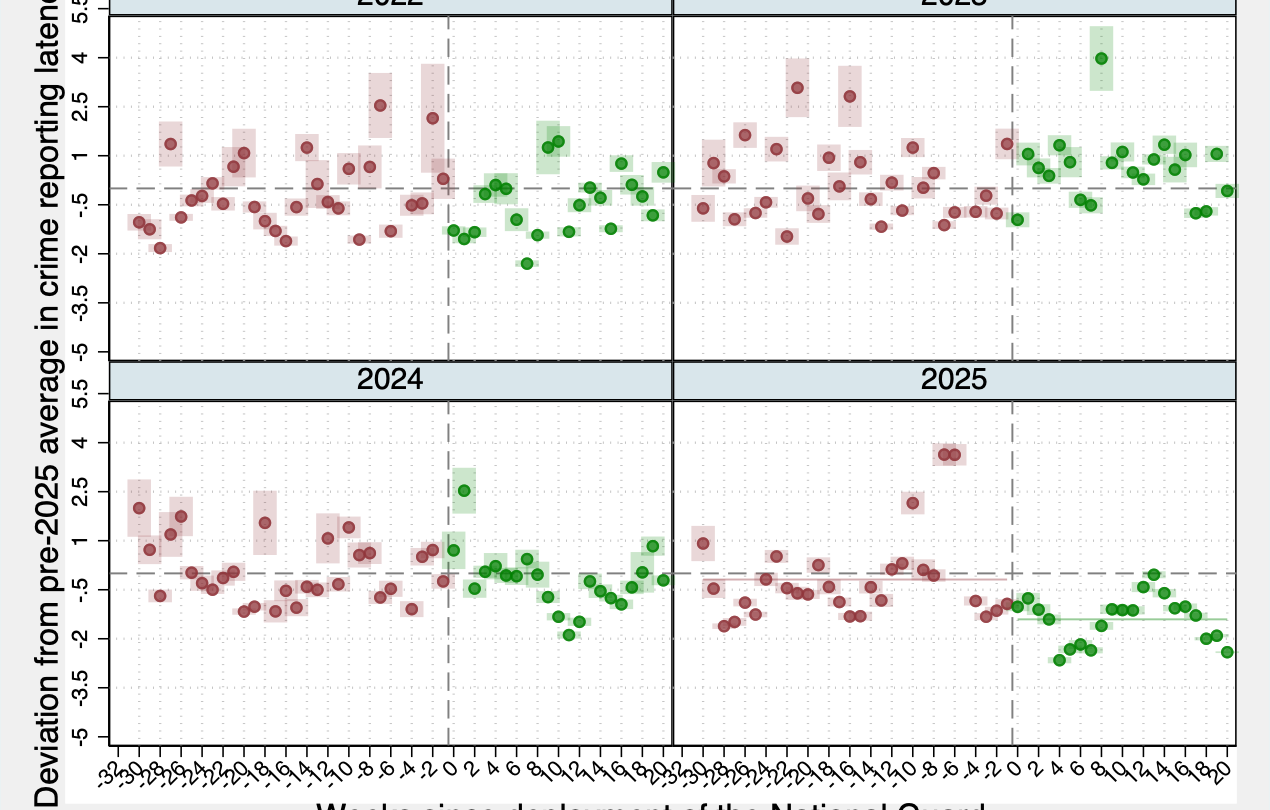
Figure 14 delivers an even more direct test: an event study of reporting lags around the National Guard deployment, as previously constructed using within-week deviations that absorb any systematic spatial clustering in delays. We use 2022-2024 as placebos. If the post-deployment crime drop were partly a recording artifact, reporting lags should lengthen after August 2025. Instead, they drift modestly downward, consistent with a reduced workload producing faster processing, not slower. The placebo years show no such pattern.
Taken together, the three figures do not support the hypothesis that MPD was manipulating the timing of crime reporting. Whatever is driving the crime decline, it is not a wave of slow reports quietly accumulating outside the measurement window. The data behave as one would expect from a department processing fewer crimes more quickly — not one cooking the books.
Figure 13. Time-Series Analysis of Crime Reporting Latency, 2020-2025
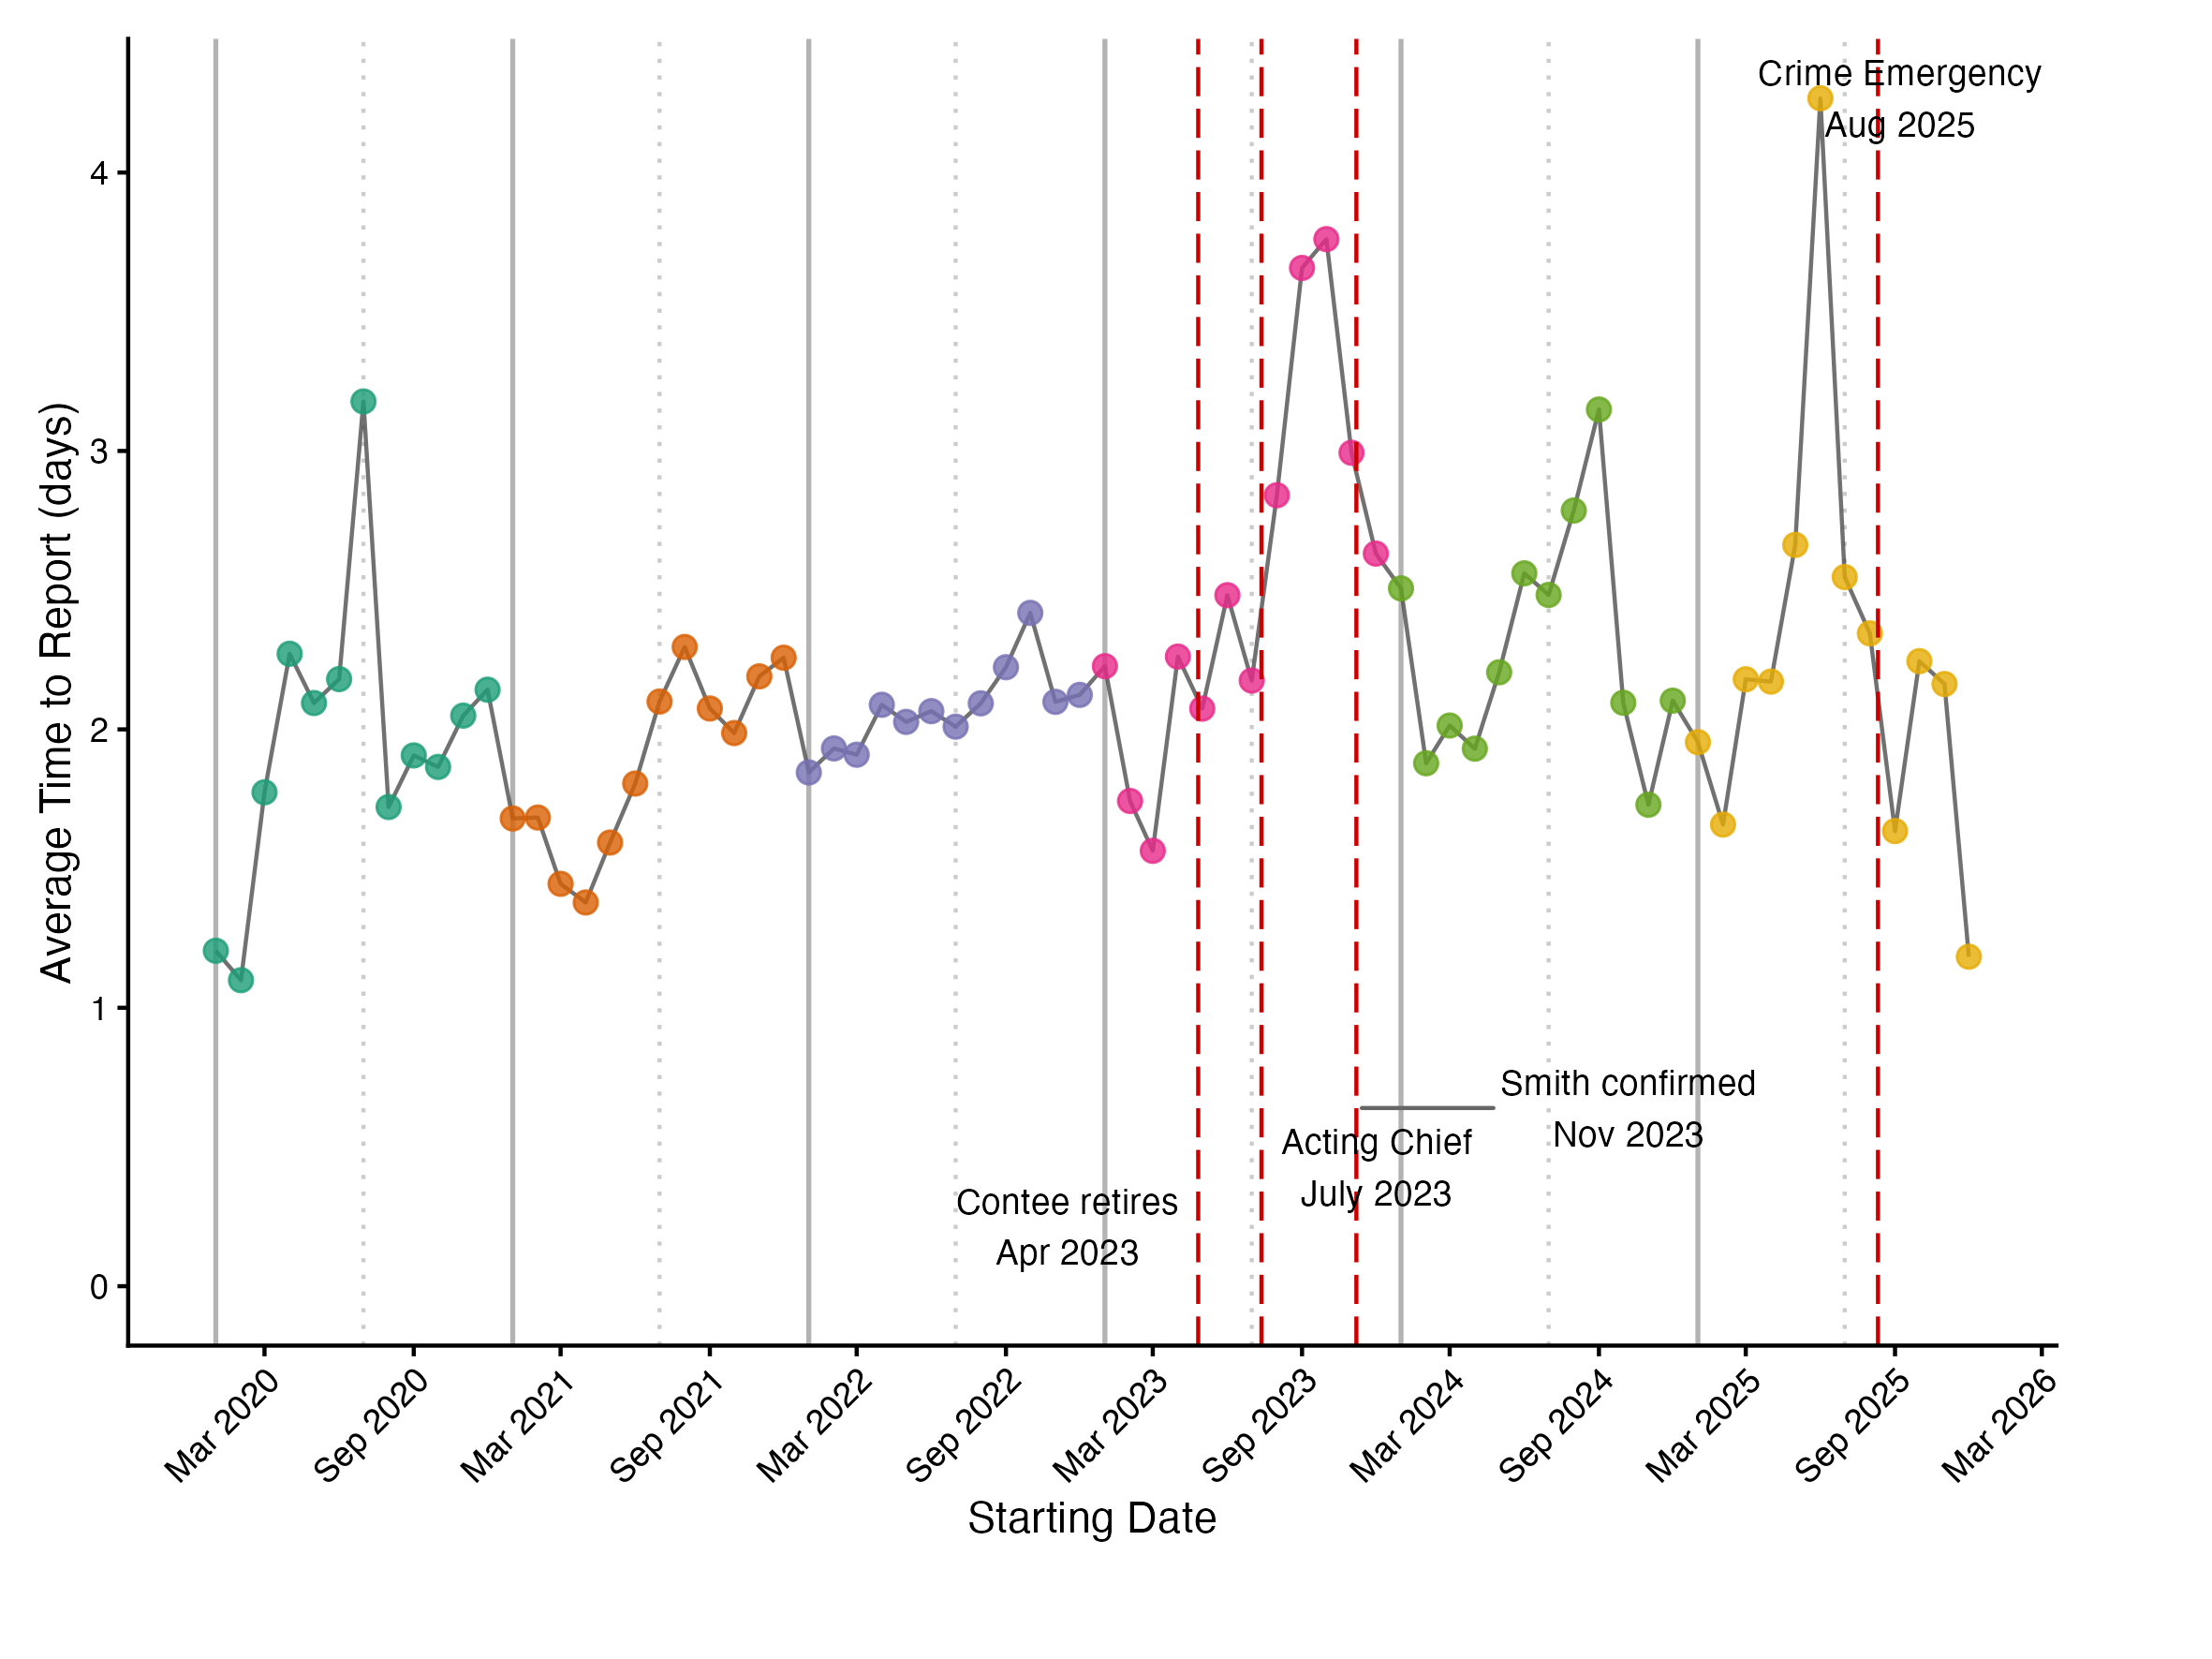
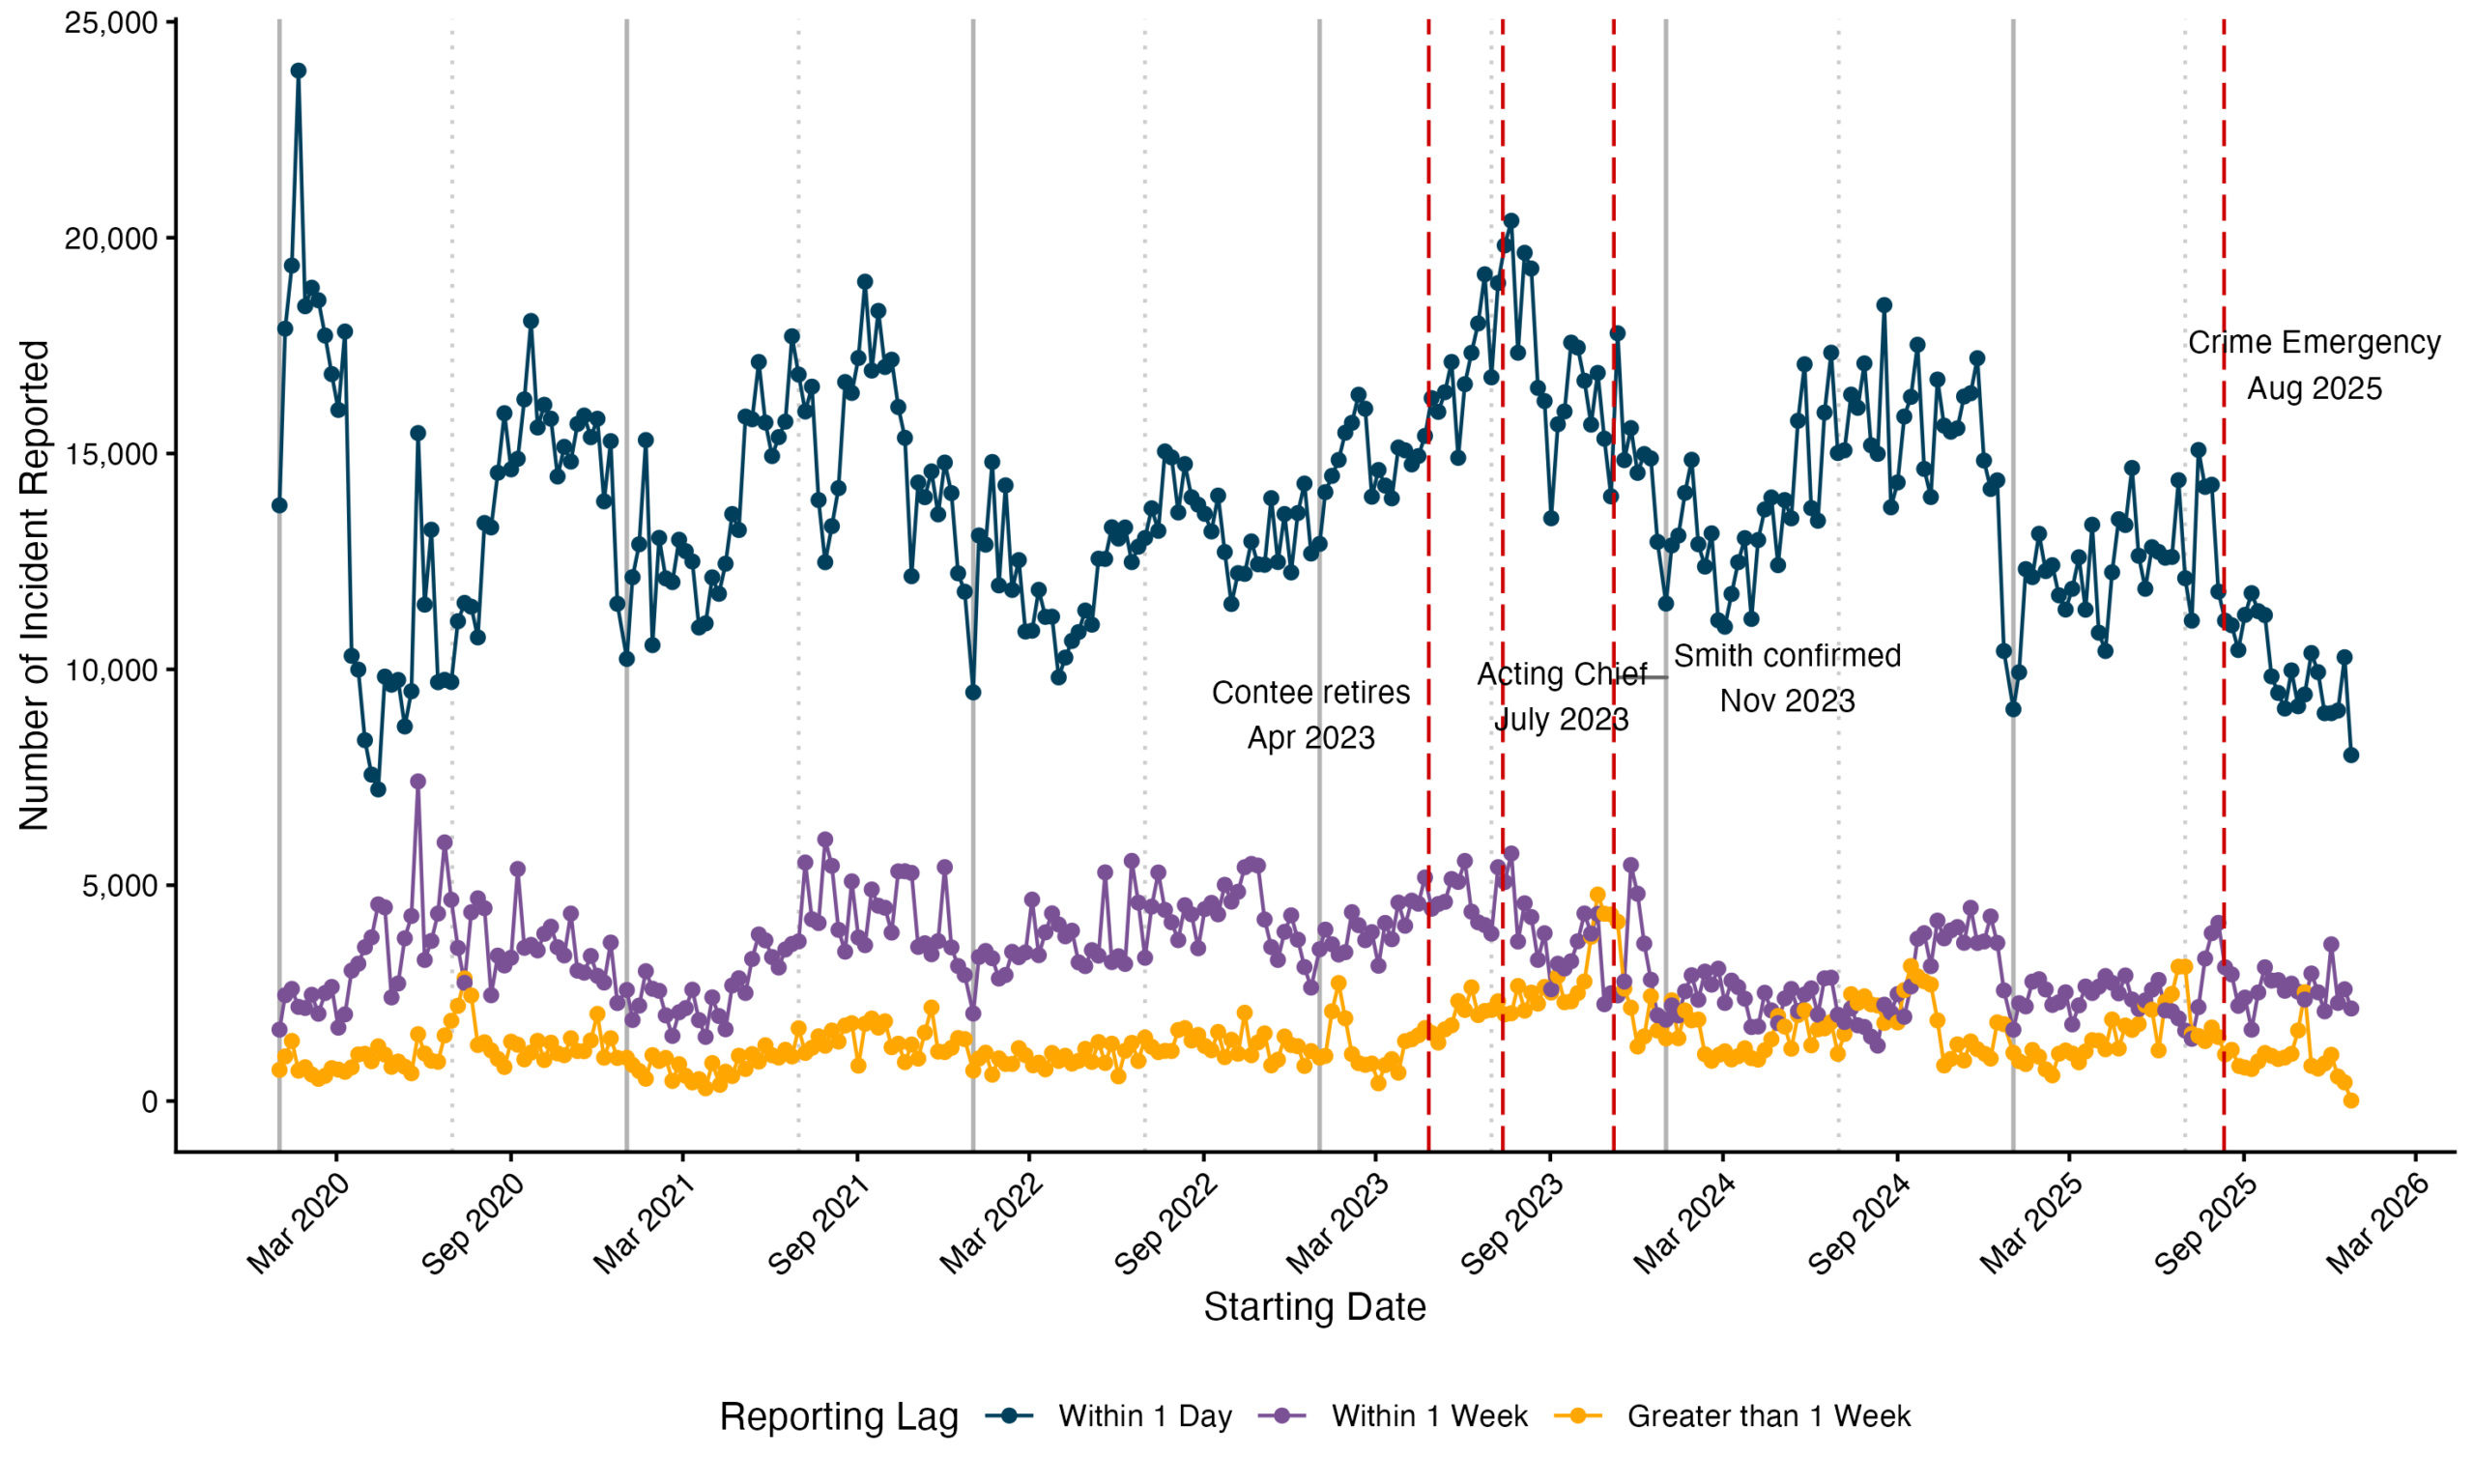
Figure 14. Avg Crime reporting latency differences from baseline, by year (2022–2025)
So, we believe we have eliminated the possibility that delayed reporting happened. This still leaves open the possibility of misclassification or other forms of manipulation. To account for these possibilities, we apply several more tests.
We compare MPD’s reported crime trends against two independently collected datasets that are plausibly correlated with crime but lie outside the department’s control: ShotSpotter acoustic gunshot alerts and 911 data. If police were artificially suppressing crime reports, we would expect crime statistics to fall even as these other indicators remained stable or rose, weakening the correlations between them.
The ShotSpotter test. ShotSpotter is an automated acoustic sensor network that detects and locates gunfire in real time. It does not wait for a 911 call. It does not depend on a victim’s willingness to engage with law enforcement. When a gun is fired, ShotSpotter records it, independently of anything a human chooses to report.
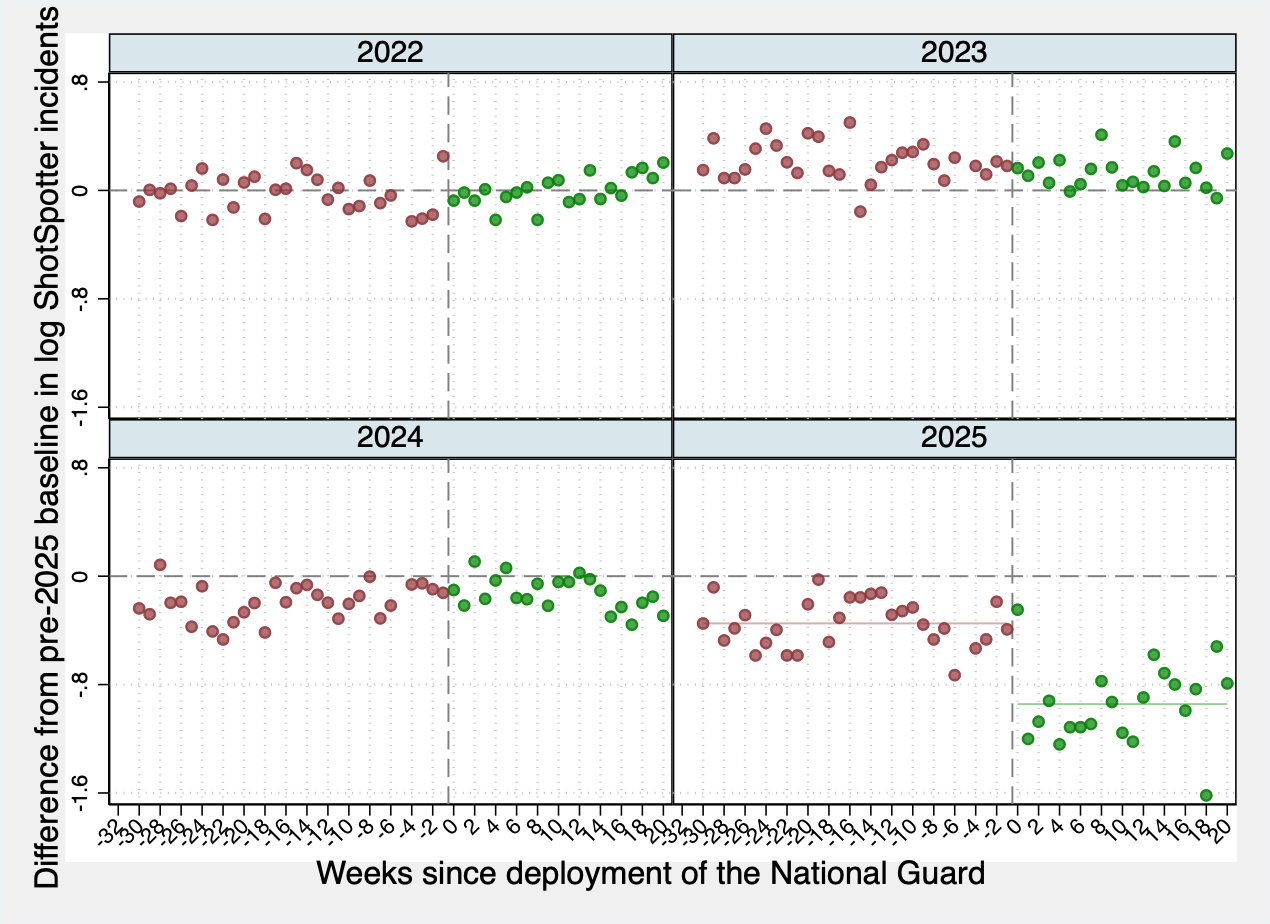
Figure 15 runs the same event study as before, but the outcome is ShotSpotter detections rather than reported crime. Two things stand out. First, look across the panels from left to right and top to bottom: The baseline level of ShotSpotter detections is itself declining year on year. In 2022 and 2023 the predeployment series hovers close to zero — near historical norms. By 2024 it is already running somewhat below, and by 2025 it is depressed further still, even before the Guard arrives. This mirrors the broader crime decline documented throughout this piece: fewer guns being fired across the city, year after year, independent of any single policy event.
Second, and on top of that downward trend, the 2025 panel shows a sharp break precisely at the deployment date.
ShotSpotter readings, already below baseline ( -.35 log points), drop further and persistently after the Guard arrives (-.94 log points), falling by approximately 0.59 log points, or about 45 percent, relative to the predeployment average, before partially recovering toward the end of the window as the initial deterrent shock may have begun to fade. The placebo years show nothing of the sort around August.
This matters enormously for the data quality question. ShotSpotter cannot be manipulated by delayed reporting, intentional misclassification, or administrative pressure on the part of the police. Observers have debated the system’s accuracy, particularly its tendency to report false positives, but there is no compelling reason to believe this tendency would change suddenly and in the opposite direction after deployment. The fact that ShotSpotter corroborates the decline in reported crime and shows its own independent break at the deployment date takes the reporting-artifact story off the table.
One apparent tension is worth acknowledging, though. ShotSpotter detects gunfire, but Figure 7 showed that reported violent crime — the category most directly associated with gunshots — barely moved after the deployment. The likely explanation is that ShotSpotter records gunshots, not crimes: Many detections reflect disputes that do not escalate to injuries or incidents that would enter official crime statistics. What the deployment appears to have reduced is lower-level, opportunistic firearm use, producing quieter streets, without fundamentally altering the deeper dynamics of violence.
Figure 15. ShotSpotter gunshot detections, event study, 2022–2025
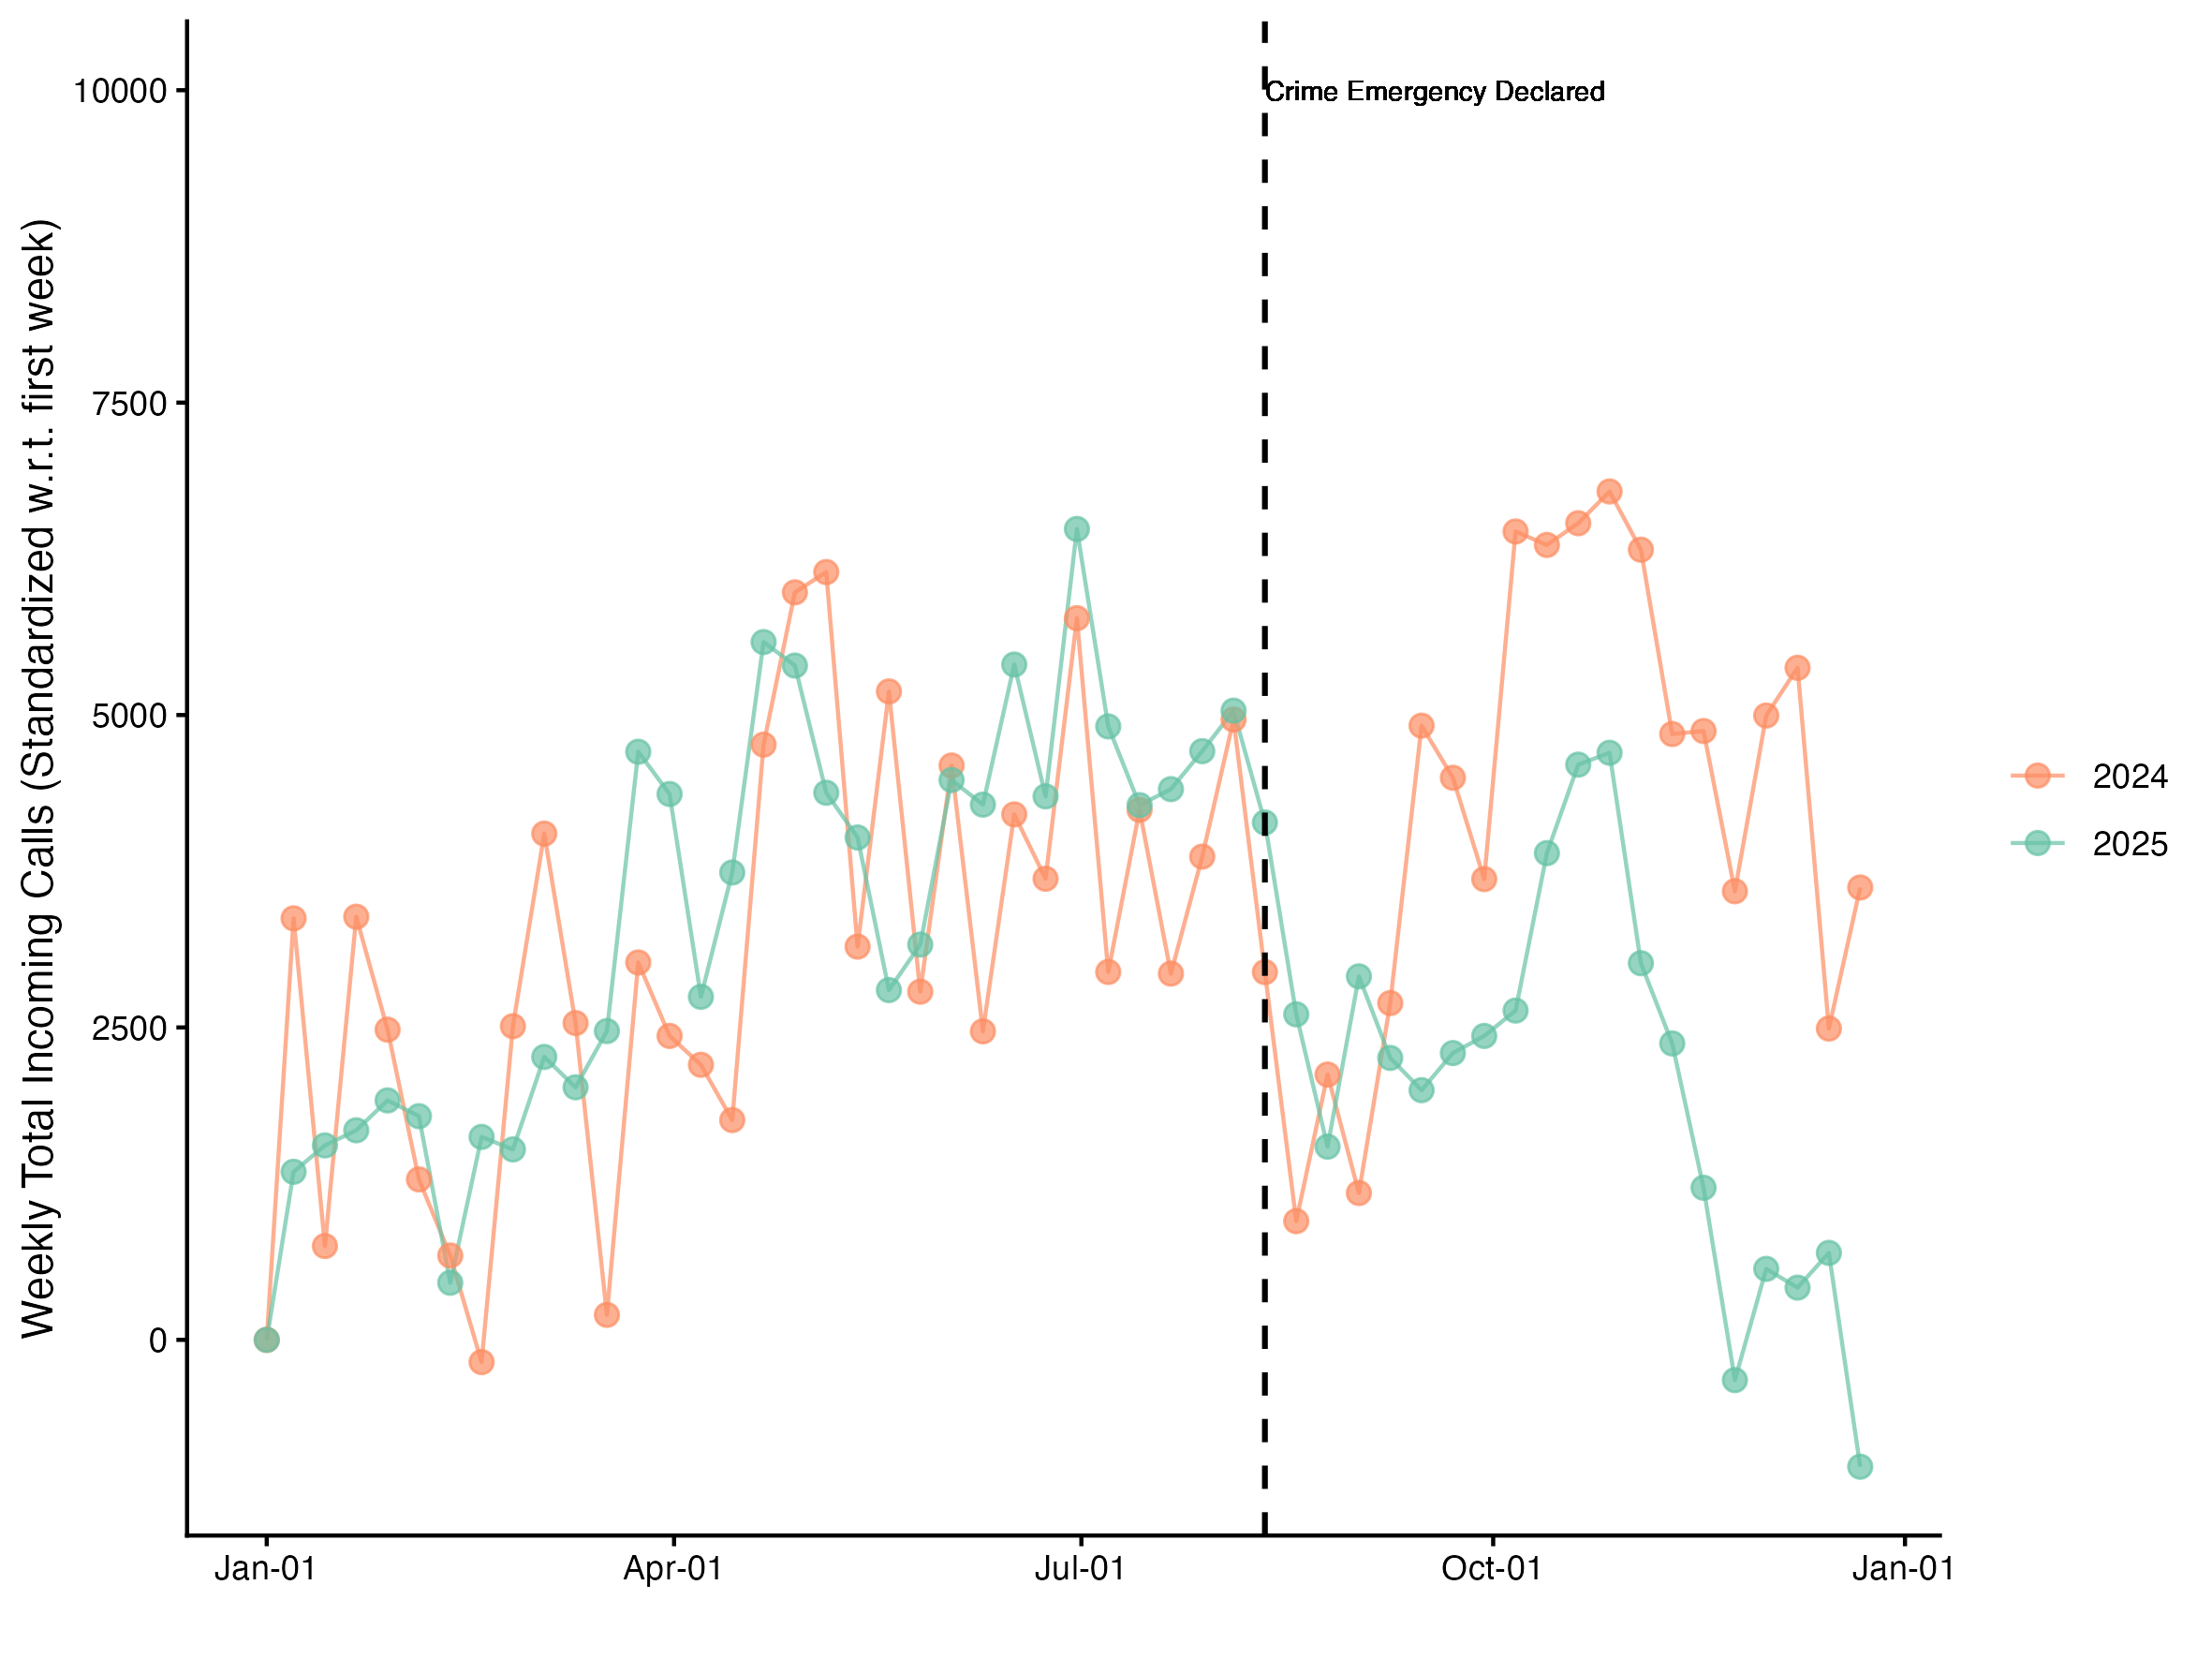
The 911 test. Figure 16 offers a complementary perspective on the same question, aggregating daily data on 911 call volumes for 2024 and 2025. Because we are not interested in the difference in levels between the two years — we know 2025 was already a lower-crime year than 2024 — both series are normalized to the same value in the first week of January. What matters is not where they start, but how they move relative to each other over the course of the year.
The two series track each other remarkably closely from January through the end of July — noisy and variable week to week, but moving nearly parallel with each other. Then both series exhibit a discontinuity in August. In 2024, call volume dips around this point and then recovers, returning to its prior range through the autumn. In 2025, the same initial dip occurs, but the recovery does not. The 2025 series stays consistently and uniformly below the corresponding 2024 values for the remainder of the year.
This pattern is precisely what a real crime reduction would produce. Two years moving in lockstep until the moment of the intervention, then diverging, with 2025 settling onto a persistently lower trajectory. If the postdeployment drop in reported crime were a reporting artifact, we would not expect 911 call volume, driven by residents seeking help in real time, to tell the same story.
Figure 16. 911 Incoming Calls 2024-2025
Efficient policing vs. the National Guard: A cost-effectiveness comparison
The National Guard deployment caused a meaningful change in crime: a 24 percent reduction in opportunistic property offenses. That finding, however, answers only half of the policy question. The other half is whether the same result could have been achieved more cheaply, and whether a different approach could have achieved more. What follows is a structured comparison of three scenarios, all anchored to roughly the same budget: the Guard deployment as it actually occurred, an equivalent investment in conventional MPD officers deployed at average citywide intensity, and the same investment directed into a targeted hotspots strategy. The numbers involve estimates from the policing literature and public budget documents, but they should be read as order-of magnitude comparisons rather than precise forecasts. The goal is to establish whether the efficiency differences across strategies are large enough to matter for policy — and they are.
What a National Guard soldier costs
The Guard’s cost is the firmest number in this analysis. We rely on figures from the Congressional Budget Office (2026), suggesting that the average daily cost per Guard member deployed to Washington was $607 — the highest of any deployment city, reflecting D.C.’s elevated lodging and logistics costs. At a deployment of roughly 2,000 personnel across the initial five-month period from August through December 2025, the total federal outlay comes to approximately $185 million.2
It is worth pausing on what that $607 per person per day actually buys. To reiterate: Guard personnel are not police officers. They can detain but not arrest. Their deployment locations were chosen for visibility and symbolic significance, and much of their work was not related to law enforcement.
There is one genuine advantage the Guard does offer that no conventional policing alternative can fully replicate: speed and scale. Roughly 2,000 uniformed personnel can be deployed to a city in a matter of days in ways that would take MPD years to accomplish through hiring and training. For a short-term deterrence surge responding to an acute crime emergency, that operational flexibility has real value.
But that flexibility comes with a hidden cost that doesn’t appear in official budget figures. National Guard members are not full-time soldiers; they are civilians with jobs, families, and professional obligations. Typical Guard members work one weekend per month and two weeks per year in their military capacity; the rest of the time they are employed in the civilian economy. A multimonth deployment pulls these individuals away from their regular work, imposing productivity losses on their employers, disruption to their households, and in some cases genuine economic hardship. These indirect costs are real and meaningful, even if they are borne by employers and families rather than by the federal treasury. A complete accounting of the Guard’s true cost would be substantially higher than the CBO’s figure.
What an MPD officer costs
MPD officers cost far less than do Guard troops: roughly $384 per officer per day. MPD’s published salary schedule puts the starting officer salary at $75,433, rising to $82,529 after the 18-month probationary period and up to $128,025 at top step. For a midcareer officer, a reasonable base salary figure is around $100,000. Adding pension contributions, health insurance, and training, which typically add 30 percent to 40 percent to base compensationfor public safety employees, yields an actual annual cost of approximately $140,000 per officer. We note that this estimate is at the highest end of the range; we choose it to produce a conservative comparison between personnel costs.
So, at $384 vs. $607 per day, MPD officers cost about 37 percent less per person than Guard personnel.
They also are fully employed in their law enforcement role every day of their careers. There are no hidden civilian economy displacement costs, no lodging bills, and no return transportation at the end of a tour. The $185 million spent on the Guard over five months could instead fund more than 1,300 additional officer-years or, equivalently, more than 3,100 officers for five months. It could also fund a sustained expansion of MPD’s overtime program, which already costs the department over $130 million annually and provides a more flexible mechanism for increasing enforcement intensity without permanent hiring commitments.
What a dollar buys: The policing literature
The critical question is not just cost but effectiveness: How many crimes does each approach prevent per dollar spent? Here the economics of policing literature offers useful benchmarks, though with important caveats about what those benchmarks measure.
The most credible estimates of police effectiveness come from quasi-experimental studies that exploit exogenous shocks to police deployment to isolate the causal effect that officers have on crime (Chalfin & McCrary, 2018; Di Tella & Schargrodsky, 2004). Two studies call our attention due to their focus on Washington, D.C., and use of more recent data. Exploiting variation in the distribution of federal COPS hiring grants across thousands of U.S. cities, Mello (2019) finds that each additional sworn officer reduces victimization costs by roughly $580,000 annually in 2025 dollars. The implied crime-police elasticities are around -1.3 for violent crime and -0.8 for property crime — meaning a 10 percent increase in officer count reduces violent crime by about 13 percent and property crime by about 8 percent. In more concrete terms, each additional officer prevents roughly 1.9 robberies and 5.1 auto thefts per year at average deployment. There is also evidence that police reduce murders: The point estimates imply that one additional life is saved per year for every nine to 10 officers hired (Chalfin, et al., 2022).
A parallel strand of research, using different natural experiments based on sudden changes in police presence such as terror alert levels in D.C. (Klick & Tabarrok, 2005), yields somewhat more conservative elasticities of around -0.30 for both violent and property crime. This lower figure is probably the right conservative benchmark for average-intensity, citywide deployment. It represents what happens when you add officers to a department without changing how they are allocated. This more conservative elasticity suggests a 3 percent decrease in crime for a 10 percent increase in officer headcount. Hotspots policing, a strategy that floods officers to specific locations where crimes are likely to occur, is among the most successfully evaluated interventions available to patrol officers. Hotspots interventions produce crime reductions of 20 percent to 35 percent in the specific areas where officers are concentrated (Turchan & Braga, 2024). This expected reduction is not directly comparable to reductions expected from police hiring: the first is a local treated-area effect, the second is a citywide average effect. To compare them on a common basis, we note that concentrating officer hours in the 15 percent of D.C. blocks with the highest rates of crime — consistent with the crime geography documented in Section II — would increase effective local presence roughly sixfold relative to uniform deployment. After accounting for diminishing returns implicit in the elasticity framework, we apply a conservative 3x citywide efficiency multiplier relative to Scenario B. This multiplier is grounded in D.C.’s specific crime concentration rather than borrowed wholesale from the hotspots literature, and the scenario conclusions are robust to a multiplier as low as 2x.
Hotspots policing is resource-intensive and could not be sustained city-wide. MPD’s existing strategy, including its ATLAS and THRIVE programs, include elements of hotspots policing. It’s difficult to say how much more crime could be reduced by expanding hotspots to more locations and more shifts. We include hotspots in our analysis here as an example of a patrol strategy that gets maximum return on investment in specific places, a reasonable ceiling for our estimates of what could be gained by recalibrating police allocation based on the observed geography of crime.
Three scenarios, one budget
With these inputs, we can compare what roughly $185 million — the approximate cost of the Guard’s first five months — might purchase across three different approaches. Each comparison is necessarily approximate; the goal is to establish the order of magnitude of the efficiency differences.
We use the following assumptions:
1. We estimate the total cost of the Guard’s first five months of deployment at approximately $185 million, based on CBO figures, and use this figure in all scenarios. We use a total cost of $140,000 per officer-year for MPD sworn officers, which includes salary, benefits, and overhead.
2. The social value of a prevented crime is drawn from Heaton (2010), updated from 2007 to 2025 dollars using the Consumer Price Index (a multiplier of approximately 1.52). We use the following per-incident estimates: murder, $13.1 million; robbery, $102,000; motor vehicle theft, $13,800. For nonauto property crime, we construct a weighted average using the composition of MPD’s nonauto property crime category — approximately 70 percent larceny ($3,300), 7 percent burglary ($19,900), and 23 percent other offenses (assigned larceny-level costs as a conservative floor) — yielding a blended estimate of approximately $4,500 per incident.
3. For the Guard deployment (Scenario A), we use the 24 percent reduction in property crime estimated in our event study. For average citywide deployment (Scenario B), we apply the conservative elasticity of -0.30 from Klick and Tabarrok (2005). For targeted hotspots deployment (Scenario C), we apply a 3x efficiency multiplier relative to average deployment, consistent with the hotspots policing literature (Turchan & Braga, 2024; Weisburd et al., 2024).
Scenario A is the Guard as deployed. The deployment produced a real reduction in crime of approximately 24 percent, concentrated entirely in property offenses. Violent crime was unaffected. At an assumed social value of $13,800 per motor vehicle theft and $4,500 per nonauto property crime, the Guard deployment fails a straightforward cost-benefit test on its own terms: The cost of preventing each property crime substantially exceeds its social value, even before accounting for the complete absence of any effect on violent crime, where the social stakes are far higher.
Scenario B replaces the Guard with an equivalent number of MPD officers deployed at average citywide intensity. At a total cost of $140,000 per officer-year, $185 million buys approximately 1,300 officer-years. Using the conservative elasticity of -0.30, and calibrating to D.C.’s 2025 crime levels, this expansion would be expected to prevent on the order of 2,400 robberies and 6,500 auto thefts, as well as roughly 140 murders, using the literature’s estimate of one life saved per 9.5 officers. Applying cost estimates to these prevented crimes — $1.83 billion from averted murders alone, plus roughly $245 million from robberies and $90 million from auto thefts — produces a total social benefit of approximately $2.2 billion: a return of roughly $12 for every dollar spent.
Scenario C is the same $185 million directed toward targeted hotspots deployment, concentrating officers in the documented crime corridors identified in the spatial analysis earlier in this essay. Applying a conservative 3x efficiency multiplier relative to average deployment produces estimated crime prevention of roughly three times the Scenario B figures: on the order of 7,000 fewer robberies, 19,500 fewer auto thefts, and perhaps 420 fewer murders over the equivalent period. Applying cost estimates to these reduction estimates yields a total social benefit approaching $6.5 billion — a return of roughly 35 dollars for every dollar invested. Even if these figures are too optimistic by a factor of two, this scenario dominates both the Guard deployment and a simple expansion of average-deployment MPD officers by a wide margin.
| Scenario A: National Guard | Scenario B: MPD (avg. deployment) | Scenario C: MPD (hotspots) | |
| Total budget | $185M | $185M | $185M |
| Cost per person per day | $607 | ~$384 | ~$384 |
| Personnel (5 months) | ~2,000 | ~3,100 | ~3,100 |
| Est. social benefit | <$185M | ~$2.2B | ~$6.5B |
| Return per dollar spent | <$1 | ~$12 | ~$35 |
What these numbers do and don’t tell us
The scenario comparison above is deliberately rough, and several qualifications should be stated plainly.
First, the most conservative elasticity estimates from the literature are derived from citywide hiring programs, not from D.C. specifically, and not from the specific crime types and neighborhoods most relevant to the comparison. D.C.’s crime concentration is unusually high even by urban standards, which probably means the hotspots multiplier is toward the high end of the literature’s range, but the precise figure is uncertain.
Second, the social cost estimates from the crime economics literature involve methodological choices, particularly around the value of a statistical life used to price murder prevention. The figures used here — around $13.1 million per murder in 2025 dollars, drawn from Heaton (2010) and updated using the CPI — sit at the upper end of the economics literature. Approaches that are based on the value of a statistical life (VSL) (Banzhaf, 2022; U.S. Department of Health and Human Services, 2024) yield more conservative estimates, closer to $8.4 million. Readers who prefer a lower VSL will get lower benefit estimates, though the qualitative rankings across scenarios are robust to a wide range of assumptions.
Third, the analysis treats crimes prevented as independent benefits, when in reality there are interactions. Incapacitating high-rate offenders through proactive narcotics and weapons arrests — MPD’s apparent strategy since 2022 — may prevent not just one crime but many subsequent ones. Conversely, concentrated enforcement in hotspots may displace some crime to adjacent areas, reducing the net social benefit. The hotspots literature (Braga et al., 2019) finds that displacement is typically less than full, and that benefits often diffuse outward into surrounding blocks rather than the reverse, but this is not universal.
Fourth, and most fundamentally, the comparison between Scenarios A and B or C is not just about efficiency, it is about what kind of crime gets prevented. The Guard’s effects were concentrated in opportunistic property offenses in public spaces. Scenario C’s effects, by design, would concentrate on the persistent violent crime in D.C.’s highest-need neighborhoods. Preventing a murder in Congress Heights, a high-crime neighborhood in the city’s Southeast quadrant, produces social benefits orders of magnitude greater than those of preventing a vehicle theft from a tourist corridor near Union Station at the foot of the Capitol complex. Any cost-effectiveness analysis that treats crimes as homogeneous misses the most important dimension of the comparison.
The bottom line
The National Guard deployment was not a waste. It produced a significant reduction in property crime, and it did so quickly, which matters when residents and businesses are demanding visible action.
But it was an expensive tool deployed in the wrong places for the wrong types of crime, at a daily cost per person 60 percent higher than an MPD officer, with a hidden productivity cost to the civilian economy.
A well-designed MPD deployment of equivalent cost, targeted to D.C.’s documented hotspots and oriented toward the violent crime problem that the Guard did not touch, would be expected to produce social benefits an order of magnitude larger. That gap — between what the Guard delivered and what smart conventional policing could deliver — is the quantitative case for treating allocation and targeting as the central policy levers in public safety, rather than the blunt instrument of visible military-style presence or sheer headcount levels.
MPD’s recent operational history offers genuine precedent for the targeted approach this analysis recommends. The case we are making is therefore not for an unfamiliar departure from current practice, but for a more systematic, continuous, and data-driven extension of strategies the department has already piloted. The gap that remains is the one between episodic, initiative-based targeting, in which an operation is launched in response to a specific surge and stood down once the surge subsides, and a sustained allocation framework grounded in granular, real-time data on officer presence and crime exposure across the city.
The measurement problem
Realizing that potential, however, requires something the current policing infrastructure does not provide: granular, real-time data on where officers actually are, matched against real-time crime data, to enable the kind of dynamic hotspots targeting that the literature identifies as the high-return strategy. The cost-effectiveness comparison exposes a deep problem: we currently lack the data analytic infrastructure to optimize allocation even if we wanted to.
Staffing levels are how police departments are evaluated, budgeted, and debated, but officer counts are a poor proxy for what actually affects crime most, which is exposure: how much police presence there is, in the places and at the times where crime actually occurs. Without granular data on where officers actually are — by block, by time of day, by day of week — it is impossible to distinguish between a large force thinly spread and a smaller one sharply focused. Without that data infrastructure, the gap between what is possible and what MPD actually achieves will remain invisible to both department leadership and policymakers — and the temptation to reach for expensive, visible interventions like the Guard will persist.
One avenue for addressing this measurement problem is to exploit natural experiments in policing that generate quasi-random variation in officer presence across neighborhoods. Our research team is currently pursuing such a project, leveraging the redistricting of police district boundaries in Washington, D.C. Redistricting periodically reshuffles which census blocks fall under which Police Service Areas (PSAs), inducing shifts in patrol assignments and coverage patterns that are driven by administrative and geographic constraints rather than underlying crime trends. By comparing blocks that experienced changes in PSA membership with otherwise similar blocks that did not, we can isolate the causal effect of patrol reallocation on crime outcomes, separating the impact of where officers are deployed from the many other factors that shape neighborhood safety.
One of the project’s central innovations is a direct measure of officer presence at the census block level, tracking not just how many officers are assigned to an area on paper, but where they actually spend their time during shifts and which blocks are systematically underpatrolled relative to their official assignments. This is precisely the kind of granular presence data that the cost-effectiveness comparison above shows is necessary to move from average intensity deployment to targeted hotspots policing. Beyond its application to Washington, D.C., the framework is designed to be scalable, offering a replicable template for researchers and policymakers in other jurisdictions seeking to measure and optimize patrol allocation. Closing the gap between headcount and presence is, in our view, the most important step that policing research and policy can take.
Conclusion
Washington, D.C.’s recent crime history contains three lessons that speak directly to the national debate about policing.
The first is that police headcount is not all that matters. Crime fell in D.C. as MPD shrank to its smallest size in half a century. This is counterintuitive only if we assume that the effectiveness of a police department is mostly a function of officer count. It is not. It works through how officers are deployed, what they do when on duty, and whether their activities are concentrated in the places and times where they can actually prevent crime.
The second is that MPD figured this out. The shift toward upstream, proactive enforcement between 2022 and 2025 — fewer officers, more arrests, different kinds of arrests — represents a strategic pivot that contributed to a decline in crime. This is not visible in standard staffing statistics, but it is visible in arrest composition data. Giving credit where it is due requires looking beneath the headline numbers.
The third is that the National Guard deployment demonstrated both the promise and the limits of presence-based policing. It worked — but on the wrong kind of crime, in the wrong places, and at enormous cost relative to what a targeted approach could achieve. Property crime deterrence through visible uniformed presence in public spaces is real. But violence in D.C.’s most disadvantaged neighborhoods requires something more targeted, more sustained, and more strategically aligned with the actual geography of harm.
The path forward does not necessarily require more officers. It requires knowing where the officers we have actually are, and ensuring they are there when and where it matters most. That is the measurement problem our ongoing research is designed to solve — and the policy problem this essay is designed to put on the agenda.
Endnote
A watertight causal claim would require an ideal experiment, either randomly assigning Guard deployment across D.C. neighborhoods or across cities, which is neither politically feasible nor ethically defensible when public safety is at stake. For policy interventions of this kind, quasi-experimental research designs are not a second-best compromise, but the appropriate and unavoidable frontier for credible causal evidence.
Our event study graph implicitly employs a regression discontinuity (RD) design. The running variable is the calendar week, the threshold is the first week of August 2025, and the identifying assumption is that nothing else changed discontinuously at exactly that moment other than the arrival of the National Guard. Before testing for a discontinuity, we demean each observation by its block-level, week-of-year average, absorbing both permanent neighborhood characteristics and seasonal patterns. The RD is therefore run on residuals, making the smoothness assumption around the threshold considerably more credible: The predictable components of crime have already been removed, and what remains is genuine deviation from the norm on either side of the deployment date. The placebo years are the design’s main falsification test. They confirm that August produces no break in any year in which there was no deployment, ruling out seasonality and other recurring factors that would produce an annual discontinuity around the same calendar date.
The main residual threat to identification is a contemporaneous shock — something else that changed in D.C. in the first week of August 2025, through a separate causal process that the within-block, within-week demeaning does not absorb because it is neither a permanent neighborhood characteristic nor a predictable seasonal pattern. The MPD nonresponse figures rule out a simultaneous surge in sworn officers or a change in arrest patterns. The ShotSpotter and 911 evidence address measurement concerns and endogenous misreporting of crime statistics.
About the authors
Erich Battistin is a Professor of Economics at the University of Maryland, a Faculty Associate at the Maryland Population Research Center (MPRC), a Research Fellow at the Institute for the Study of Labor (IZA@LISER), the Centre for Economic Policy Research (CEPR), and at the ROCKWOOL Foundation Berlin (Institute for the Economy and the Future of Work), and a Research Affiliate at FBK-IRVAPP. His research develops econometric methods for causal inference and policy evaluation, and applies these methods to questions in labor economics, education, consumption, household behavior and measurement using large administrative and survey datasets. He has served as principal investigator on projects funded by national and international organizations in Europe and the United States.
Richard Hahn is Senior Manager for Research and Evidence in the Niskanen Center’s Criminal Justice Department. His work focuses on program evaluation and policy analysis using applied econometric methods, with an emphasis on translating rigorous empirical research into practical tools for policymakers and practitioners. Before joining Niskanen, Hahn was a research scholar at New York University’s Marron Institute of Urban Management, where he served as executive director of the Crime and Justice Program. He has also worked with the Violence Reduction Center at the University of Maryland, where he was a Dean’s Fellow and Wylie Fellowship recipient. He is currently completing a doctorate in criminology at the University of Maryland.
Samantha Pérez-Dávila is a Research Fellow at the Niskanen Center, where she works on drug policy and the effects of policing on crime. She is also an Assistant Policy Researcher at RAND and a Ph.D. candidate at the RAND Graduate School, where her dissertation examines illegal cannabis markets in the United States and Mexico. She holds an M.Phil. in Policy Analysis from the RAND Graduate School and an M.Sc. in Applied Economics from Johns Hopkins University. Borui Sun is a Ph.D. candidate in Agricultural and Resource Economics at the University of Maryland, College Park, specializing in development economics with a focus on causal inference and policy evaluation. Her research applies empirical methods to questions in political economy and labor economics, including political selection, local governance, urban crime, and gender bias in digital labor markets. Before starting her Ph.D., she was a research associate at the World Bank Development Impact (DIME) group. She holds an M.P.P. from the University of Chicago and a B.A. from George Washington University.
What our design cannot speak to are changes in prosecutorial pace, federal enforcement activity, or shifts in what existing officers were doing rather than where they were deployed. The honest interpretation of our 24 percent estimate is therefore the effect of the full emergency response, of which the Guard’s presence was the most visible and measurable component, rather than the Guard’s effect in strict isolation. That said, alternative explanations are theoretically possible but face a timing problem. Faster prosecutions, federal enforcement surges, and changes in MPD tactics are slow-moving institutional responses that ramp up over weeks and months, not overnight. The crime drop we document appears immediately at week zero and persists. Whatever confounding factor may have produced the discontinuity, it arrived on the streets at the same moment the Guard did. To corroborate this point even further, the deployment was, by all accounts, unanticipated (Park & Williams, 2025) and executed within days, without the kind of public buildup that would allow potential offenders to adjust their behavior in advance or other institutional actors to coordinate responses in anticipation. A sudden, unforeseeable intervention is harder to confound with slow-moving institutional changes that require planning and ramp-up time, and it validates the predeployment series as a clean counterfactual as the weeks before August in the 2025 panel reflect genuine baseline crime levels, not behavior already shaped by the prospect of the Guard’s arrival.
- More recently, an MPD Internal Affairs Department investigation accused more than a dozen police managers of reclassifying low-level felonies to misdemeanors. Although no official report is available, nor is the strength of the accusations clear, the alleged reclassifications appear to be concentrated among a few hundred property crimes that occurred between 2024-2025 in the Second District. To address these specific allegations we conduct analyses without Second District data. If misclassification is driving our findings, they should be substantively smaller when we remove these data; we find no significant difference (a slight increase in the size of the crime decline) and reject this threat to our findings. ↩︎
- By early 2026, with personnel levels rising to nearly 2,700, the cumulative tab had crossed $330 million, and projections suggest it could reach or exceed $600 million if the deployment runs through August 2026—a figure that would exceed MPD’s entire annual operating budget of $599 million. ↩︎