
In many ways, America’s social safety net falls short of those of our liberal democratic peers, yet we have no shortage of policies intended to provide social protections. We have programs at all levels of government that offer help with family income security, child care, nutrition, health care, housing, education, unemployment, disability, and other needs. But too often, each program has been developed in asilo, with little thought to how it interacts with others.
The result is a social policy landscape that is hard to navigate for families needing help. Along the road from dependency to self-sufficiency, they encounter benefit cliffs, disincentive deserts, eligibility barriers, and other obstacles. Too many fall wayside and remain poor, despite all the programs that ought to make their lives easier.
This commentary explores this social policy landscape. It reveals a pattern of work disincentives that bear hardest on the near-poor, that is, on households that are almost at the point of achieving full economic self-sufficiency, but are not quite there yet. After an overview of the terrain, it offers ways to make the social safety net more helpful and more work-friendly.
The working poor and near-poor
Designing a safety net would be much easier if income support policies affected only people who could not work or could not find work. However, as the data charted in Figure 1 shows, half of all poor families have at least one member who has worked full- or part-time for at least part of the previous year. Among those between 100 and 200 percent of the federal poverty level, three-quarters of families have at least one worker.
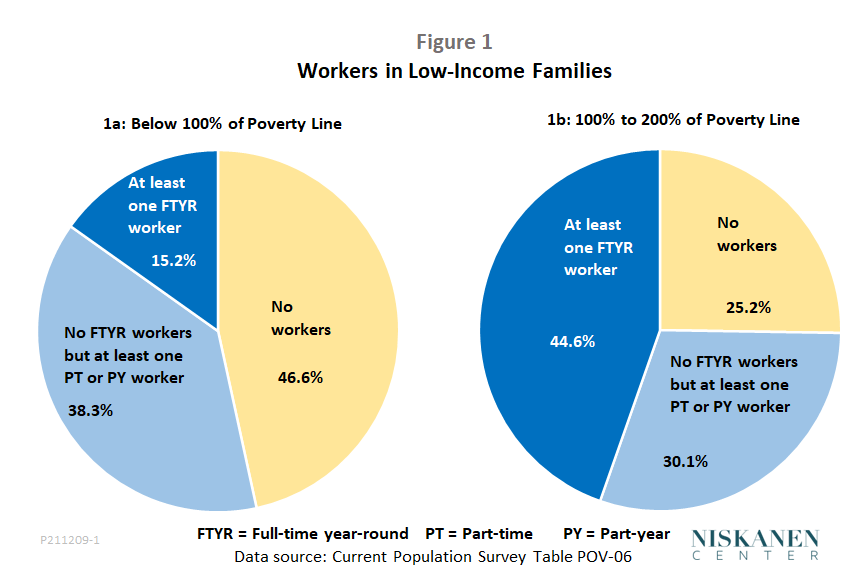
The Census Bureau has official definitions for working poor (below the poverty line and at least 27 weeks a year in the labor force) and near-poor (100 to 125 percent of the poverty line). Journalists and academics often treat those terms more broadly, however. One source speaks of the near-poor as people “who drive cars, but seldom new ones; earn paychecks, but not big ones, and view themselves as barely scraping by.” I, too, will use a broader definition, defining “near-poor” as 100 to 200 percent of the poverty line and “working poor” as anyone in a household below 200 percent of the poverty line that has at least one member who works at least part-time for at least part of the year. But however the terms are defined, it is clear that any income support policy that hopes to be effective must keep the working poor and working near-poor in mind.
Unfortunately, many of today’s policies do not work well for low-income working families. True, the Earned Income Tax Credit (EITC), under which benefits initially increase with earnings, offers substantial incentives for initial entry into the labor market. However, the situation changes as income increases. Families with earnings closer to and just above the poverty level encounter various disincentives to taking on the extra hours of work or the extra job responsibilities needed to complete the transition to full financial independence. The following sections track several kinds of work disincentives. Benefit reduction rates (BRRs) are features of means-tested programs that cause benefits to decrease by a certain amount for each additional dollar earned. For example, food stamp benefits decrease by 24 cents for each dollar of earnings. Effective marginal tax rates (EMTRs) add the rates of payroll and income taxes to benefit reduction rates. For example, adding a 7.65 percent payroll tax rate to the benefit reduction rate for food stamps gives an EMTR of 31.65 percent. What Craig Richardson and Zachary Blizard call disincentive deserts are income ranges over which EMTRs approach 100 percent, so that additional earnings bring little or no increase in net income. Finally, benefit cliffs are sharp cutoffs of benefits that occur when earnings reach specified thresholds. Medicaid, TANF, and Section 8 housing vouchers provide examples.
The general pattern of disincentives has long been known, including the tendency for disincentives to bear hardest on near-poor households. A new online calculator from the Atlanta Fed makes it easy to examine them in greater detail than previously. The calculator provides data on benefits by program for annual incomes at intervals of $1,000. It also makes it possible to vary family structure, program participation, and city of residence at the click of a mouse. The data are both available as charts and downloadable as spreadsheets. These and other features make the Atlanta Fed’s calculator more useful to researchers than other online calculators, many of which were designed to help individual families navigate the maze of benefits, cliffs, and deserts (e.g., [1] [2] [3] [4]).
A hypothetical Boston family
Let’s begin with an example chosen less for realism than for its ability to illustrate how multiple programs interact. This example should be regarded neither as a worst nor a best case, but, as I will explain, a little of each.
The hypothetical family in question consists of one adult and two young children, aged 3 and 5, living in Boston. Depending on income, the family receives a wide range of benefits, including Medicaid, the EITC, the Child Tax Credit (CTC), Temporary Assistance for Needy Families (TANF), Section 8 housing vouchers, Child Care and Development Fund (CCDF) subsidies, and Affordable Care Act (ACA) premium subsidies. Figure 2 shows those benefits by program and income, based on the Atlanta Fed’s online calculator data.[1]
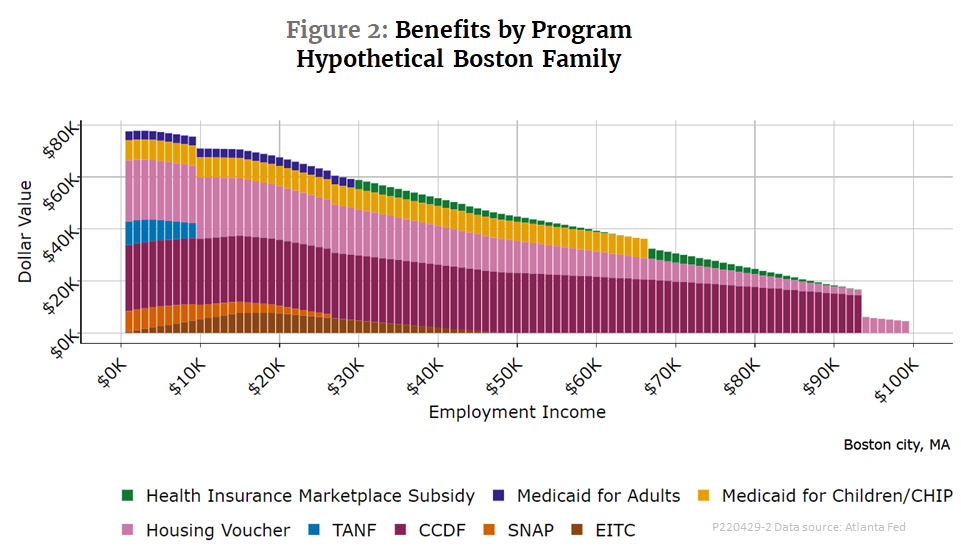
Figure 3 shows how the family’s net income varies as its employment income varies. Net income is defined here as employment income plus benefits less taxes[2]. For reference, the sloping dashed line shows points where employment income and net income would be equal. The vertical lines show the official federal poverty level (FPL) for a three-person household (approximately $22,000), twice the FPL ($44,000), and three times the FPL ($66.000).
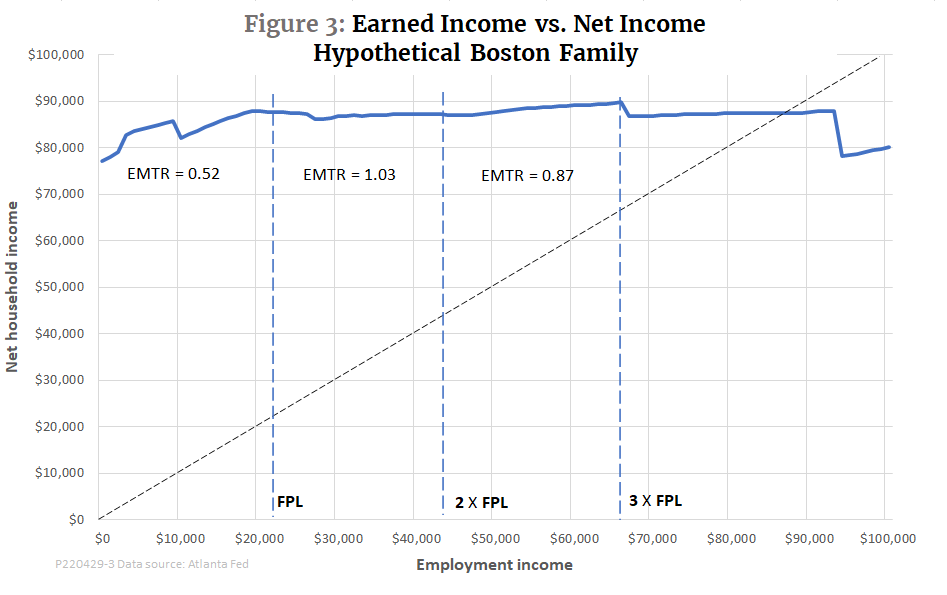
Comparing the two charts makes it possible to see how various cliffs, disincentive deserts, and other features in the net income schedule relate to the benefits received from specific programs. For the first few thousand dollars, this family’s net income rises roughly dollar-for-dollar as its earned income increases. Over the full range from no earned income to the FPL, the effective marginal tax rate averages 52 percent. The relatively moderate EMTR is due to the phase-in of EITC and CTC benefits at sufficient rates to offset about half the effect of income taxes, payroll taxes, and reductions in TANF, SNAP, and housing benefits. The Atlanta Fed data show a benefit cliff at $9,000 where eligibility for TANF ends. After that, net income once again grows with earnings.
By the time the family reaches the poverty line, the EITC is in its phase-out range. SNAP benefits complete their phase-out at $26,000. After $29,000, adult Medicaid benefits, which have no phase-out, are replaced by ACA premium support subsidies, which do have a phase-out. Putting everything together, the income range between $22,000 to $44,000 is a nearly perfect example of a disincentive desert.
No single program accounts for the complete absence of work incentives. Instead, the benefit reduction rates of various programs, together with income, payroll, and sales taxes, add up to an effective marginal tax rate of 103 percent. After taxes and transfers, the annual net income for this family actually falls a bit, from $87,686 to $87,062, as earned income increases from $22,000 to $44,000.
Between two and three times the FPL, the EMTR falls slightly, although it averages a still-high 87 percent. But more trouble lies ahead. At the $66,000 mark, the family loses child Medicaid, which is only partially replaced by family ACA subsidies. Then, at $93,000 of earned income, the family loses its last $14,470 of benefits from the Child Care and Development Fund. All in all, then, even at $100,000 of earned income, the family is worse off than when its earnings first reached the poverty level and only $3,000 better off than when it had no earned income at all.
For completeness, it is worth pointing out that despite the very high EMTRs that make the net-earnings line almost flat through much of the range shown in the chart, there may still, in practice, be some incentives to work. For one thing, work generates immediate cash income, which, dollar-for-dollar, may be valued more highly than noncash benefits like health insurance and more highly than cash benefits like EITC credits that are received only once a year, when tax refunds are paid. Also, it may be possible to conceal some earnings, such as tips or income from odd jobs, from tax and welfare authorities. But even taking those possibilities into account, work incentives are very weak. Finally, it is possible that some people will choose to work despite apparent disincentives either because they are not aware of program details or because they get satisfaction from the work itself.
This, then, is a best-case scenario, in that no one is ever poor, or even close to it. But it is also a worst-case, in that work disincentives are so pervasive that it would be a wonder if anyone bothered to hold a job at all.
A more typical Boston family
If you find the picture portrayed in Figures 2 and 3 surprising, you are not alone. Is the American welfare system really so generous with its benefits, you might well ask, and so completely destructive of work incentives as in this best-case/worst-case scenario? In reality, it is not.
A large part of the reason is that the hypothetical family represented in Figures 2 and 3 receives an unusual combination of benefits. In practice, however, several of the programs that seem to offer the most generous benefits are severely underfunded, so relatively few families are actually able to obtain them. For example, according to congressional testimony from the Center on Budget and Policy Priorities, 68 percent of poor families with children received Aid to Families with Dependent Children in 1996. By 2015, after the welfare reforms of the Clinton era, benefits from TANF, which replaced AFDC, reached just 23 percent of poor families with children, according to the same source. Similarly, just 8 to 12 percent of eligible families receive child care benefits from the CCDF, and just 24 percent of those eligible receive Section 8 housing vouchers.
As a result of underfunding and other eligibility barriers, studies that focus on typical rather than hypothetical households find that most poor families receive only a subset of the benefits shown in Charts 2 and 3. For example, a study from the Department of Health and Human Services found that among families with children and with incomes below 200 percent of the poverty line, the single most common combination of benefits (24 percent of such families) is SNAP, EITC, CTC, and Medicaid. Another 35 percent of such families receive benefits from just two or three of those four programs.
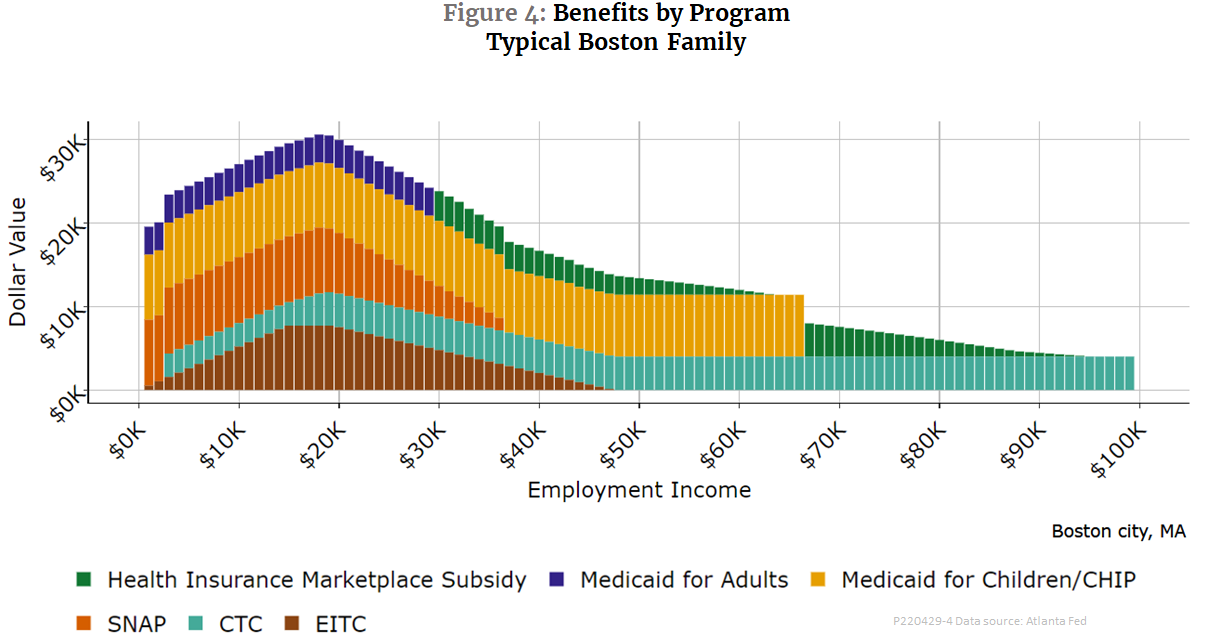
Figures 4 and 5 show benefits by program and net income for a typical Boston family with two children when enrolled only in the most common four-benefit combination, SNAP, EITC, CTC, and Medicaid, with health coverage that transitions to the ACA marketplace after Medicaid eligibility ends.
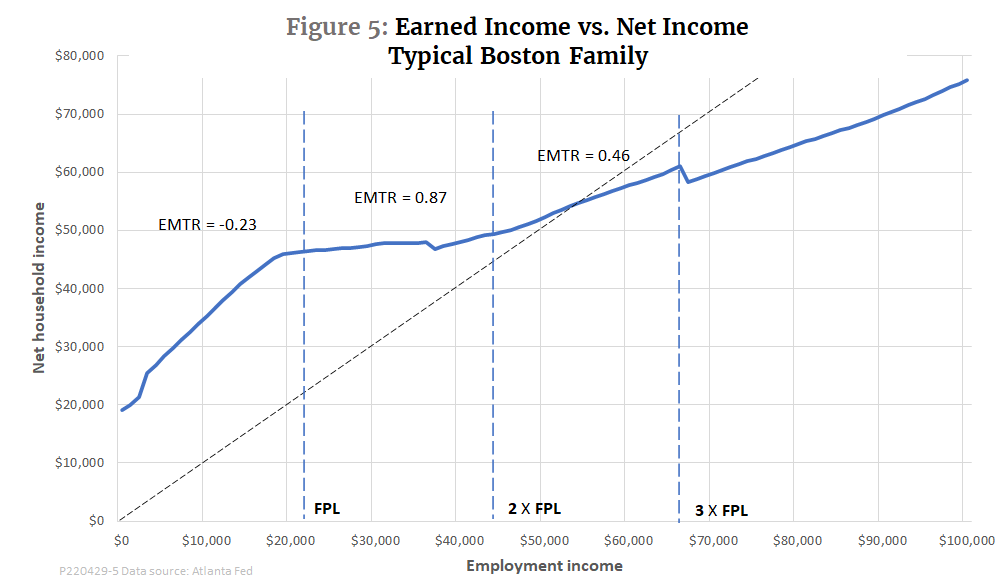
A comparison of Figures 4 and 5 with Figures 2 and 3 brings out some important differences. The first is that the typical family’s net income (employment earnings plus benefits minus taxes) is much lower at every level of income than those of the hypothetical one. For example, when earnings are $22,000, the typical family’s net income is $46,433, compared with $87,061 for the hypothetical family that receives benefits from nine programs.
There is also a dramatic difference in the work incentives for the two families. The typical family’s average effective marginal tax rate in the range from no earned income to the federal poverty level is now minus 23 percent, much lower than the positive 52 percent shown in Figure 3 for the hypothetical family. As a result of the negative EMTR, the typical family’s net income actually increases faster than earned income; each dollar earned brings $1.23 in cash and benefits. However, the typical family’s EMTR is much higher once it passes the poverty threshold, averaging 87 percent over the range from 100 to 200 percent of the FPL. In the worst part of that range, from $30,000 to $36,000, the EMTR rises to 95 percent, effectively a disincentive desert.
The difference between the pattern of incentives shown in Figures 3 and 5 is partly because the typical family does not receive TANF or housing benefits. However, child care expenses also play an important role.
Unlike the hypothetical family shown in Figures 2 and 3, the typical family represented by Figures 4 and 5 does not receive benefits from the CCDF, which are designed to cover the full cost of at-work child care. Child care is expensive in Boston. The Atlanta Fed estimates that care for two children in an approved facility costs about $12.50 an hour. That would be prohibitive for workers near the low end of the wage scale. To be able to work, the parent in this family will probably scrounge around to find some less formal child care arrangement that, while not free, costs less. In constructing the example, I assume that the parent finds child care at the cost of $6.25 an hour, half as much as the Atlanta Fed’s estimate.
Even $6.25 an hour would be a huge bite out of wages for someone working at the Massachusetts minimum of $14.25 an hour. Fortunately, though, federal rules make child care expenses fully deductible from earnings when calculating SNAP benefits. As a result, the family faces no reductions in SNAP benefits until earned income reaches $19,000, and SNAP benefits do not fully phase out until earnings reach $36,000. That makes work possible, but it also means that for families in the near-poverty range, SNAP, the EITC, and ACA subsidies all phase out simultaneously, pushing up the EMTR.
It matters where you live
The two examples above pertain to a family living in Boston, Massachusetts, a blue state with relatively generous income security programs. One more example will cover a similar family living in Atlanta, Georgia, a red state with less generous income support. Figure 6 gives the details by program for a typical Atlanta family and Figure 7 shows the relationship between the family’s net income and employment income.
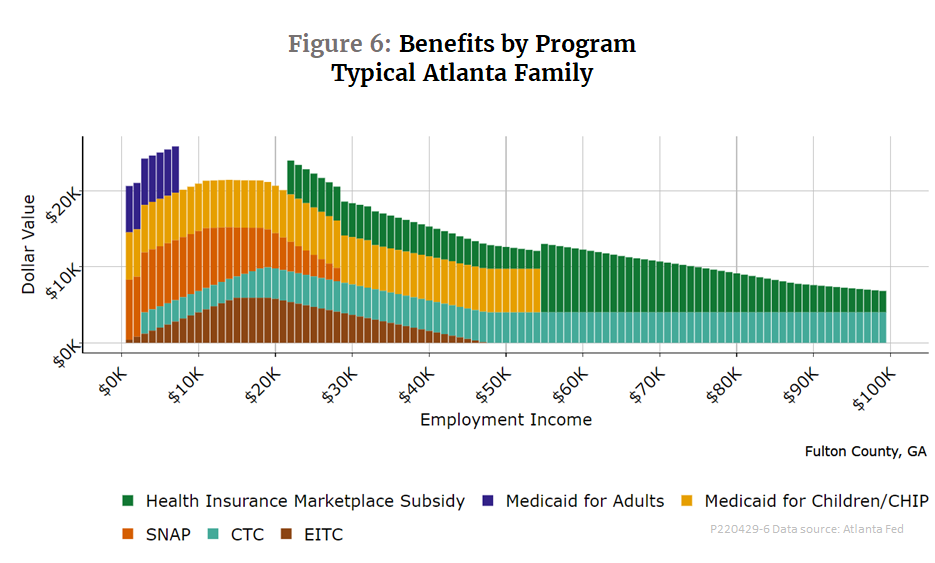
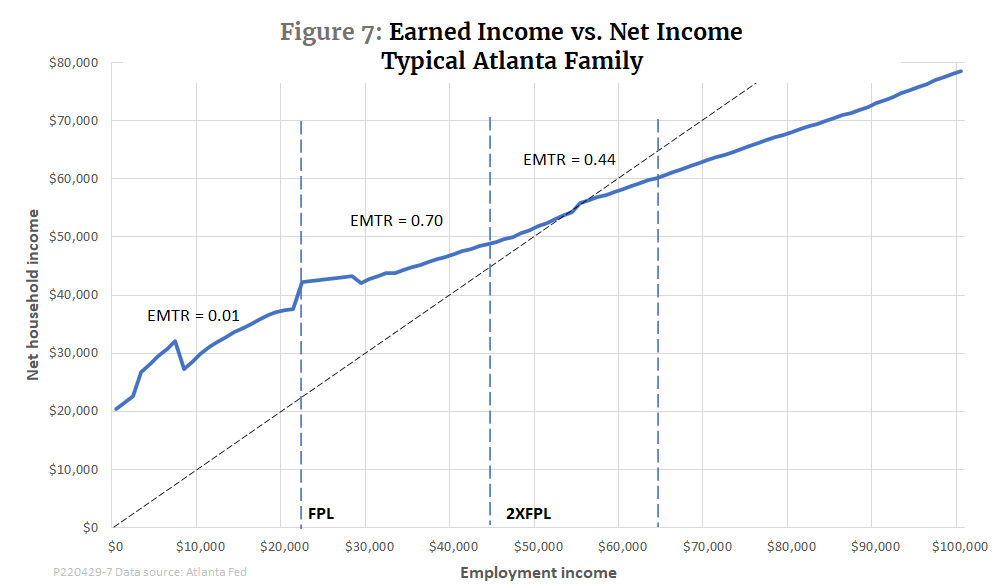
Comparing the Boston and Atlanta families shows that where you live matters in several ways. The most important is that Georgia is not an expansion state under the ACA, so the cutoff for adult Medicaid occurs at a far lower level of earnings — just $7,000 in Georgia, compared with $29,000 in Massachusetts. The result is a gap between Medicaid and ACA eligibility for adults. (Child Medicaid, or CHIP, is available up to an income of $54,000.) Largely because of the Medicaid gap, the pattern of work incentives is different in Atlanta than in Massachusetts. Over the full range from no earnings to the FPL, net income rises almost exactly dollar-for-dollar with earned income. However, the Medicaid cliff is a major stumbling block along the way. Between $7,000 (just under half-time at the federal minimum wage of $7.25 an hour, which applies in Georgia) to $21,000 (roughly full-time at $10 per hour), the EMTR is a discouraging 60 percent.
As in Massachusetts, work disincentives begin to pile up once the family moves from poverty to near-poverty. Over the full range from 100 to 200 percent of FPL, the EMTR averages 70 percent, not quite as high as the 87 percent faced by the typical Massachusetts family, but still not very encouraging. The worst stretch occurs just above the FPL. From $22,000 to $29,000 the family’s net income actually falls by $122, creating another disincentive desert at a critical step from poverty to self-sufficiency. Once the family passes 200 percent of the FPL, the EMTR drops to a moderate 44 percent.
The Massachusetts and Georgia examples give an idea of the range of experience among states. The reader may find it worth taking some time to play around with the Atlanta Fed’s calculator (or the other, more individualized calculators cited earlier) to see how the experiences of poor families can differ as the programs they participate in, the places they live, and the number and age of family members varies. However, even the few examples we have looked at are enough to draw some general conclusions about work disincentives and what to do about them.
How to fix the disincentive problem (and how not to)
One clear lesson from our examples is that the problem of work disincentives is most acute for the near-poor – those whose earnings fall roughly in a range from 100 to 200 percent of the official federal poverty line. There are several reasons for that:
- First, the Earned Income Tax Credit, the major source of positive work incentives for the very poor, turns to neutral and then to a disincentive right around the point where a family’s earnings pass the FPL. That is an income range where other benefits, including SNAP and ACA premium subsidies, are also phasing out.
- Second, the greater the number of programs that a family qualifies for, the greater the chance that net financial resources will be high enough to allow a decent standard of living. However, a greater number of programs that phase out simultaneously means a higher EMTR in the near-poverty range and greater disincentives for moving on to full financial independence.
- Third, near-poor families who live where more generous benefits are available at the state level have higher net incomes for any given level of earnings but face higher disincentives to work.
In short, existing social policies need extensive reform to succeed in helping poor families become self-supporting. There are wrong ways and right ways to fix the disincentive problem.
One wrong approach, favored by some would-be progressive reformers, is to fund existing programs more generously to ensure that all eligible families benefit. For example, writing for the Center on Budget and Policy Priorities, Laura Meyer and Ife Floyd urge that cash assistance should reach millions more families to lessen hardship. At the same organization, Aditi Shrivastava and Gina Azito Thompson urge reforms at the federal and state levels to extend TANF to many more families.
These writers are correct to say that increasing the reach of TANF would improve the immediate financial position of many poor families. Yet, as a comparison of Figures 2 and 3 with Figures 4 and 5 shows, extending TANF to more poor families would also increase the severity of work disincentives. It seems somehow inconsistent to imply, as Isaac Shapiro and colleagues do, in still another CBPP report, that work incentives for the poor are adequate because many families are not able to qualify for TANF, housing vouchers, and other underfunded programs, and then simultaneously to advocate wider coverage and higher benefits for those very programs. This change would reduce work incentives.
At the same time, there are plenty of bad reform proposals from the conservative side. More stringent work requirements, as proposed, among others, by the Trump administration’s Council of Economic Advisers, are a case in point. Conservative advocates of work requirements seem simply to ignore two major problems of work requirements as anti-poverty policy.
One of those problems is that, as shown in Figure 1, most welfare beneficiaries already work. Of those who do not already work, most are in the earnings range of 0 to 100 percent of FPL, where the EITC already offers strong work incentives. In the near-poor range from 100 to 200 percent of FPL, where work disincentives are strongest, fully three-quarters of income-support beneficiaries already work at least part-time. Even the most stringent proposals require no more than half-time work, so they would do nothing at all to encourage what three-quarters of the near-poor really need: a greater economic incentive to work more hours, gain more skills, or take on additional job responsibilities that would increase their earnings.
As explained in an earlier critique, the other problem is that most welfare beneficiaries who are not in the labor force are not working because of caregiving responsibilities, school, illness, or disabilities that do not qualify for SSI disability status. Enforcing work requirements would not get them into the labor force; it would deprive them of benefits and make their lives harder.
What, then, might be some more constructive proposals?
First, there are small tweaks to existing policies that could mitigate many of the worst work disincentives that now confront the poor and the near-poor. Some of them could be implemented, often at the state level, without new legislation. For example, the disincentive effects of benefit cliffs could be reduced by reforms that reduced “churn,” that is, frequent cycling on and off benefits. Crossing cliffs can have collateral disincentives, such as the need to change jobs or complete complex paperwork that is not fully reflected in the Atlanta Fed’s numbers. The less they have to be crossed, the better.
A report from the Center for Law and Social Policy outlines severalstrategies to mitigate disincentives. A site called benefits.com, created by the Leap Fund, lists numerous state and federal legislative initiatives to make it easier for people to establish and maintain eligibility for benefits. Continuous enrollment for Medicaid, which reduces churn by enrolling families for 12 months at a time, is another helpful practice. Continuous enrollment was expanded during the COVID-19 pandemic but may disappear again without new legislation.
However, more far-reaching reforms would be needed to make income support policy truly more work-friendly. Here are three general principles:
- Cash out as many policies as possible. Priorities differ, both among households and over time. The pressing need of the moment for some families may be putting food on the table; for others, paying the rent; and for still others, fixing a car needed to get to a job. Cash is fungible, food stamps and housing vouchers are not. Cash always delivers a dollar of value per dollar received; recipients do not always value in-kind aid at a rate that reflects the cost of providing it.
- Consolidate cash assistance policies into as few categories as possible in order to avoid cascading benefit reductions. Elsewhere, I have suggested a policy of Integrated Cash Assistance that consists of just three components: a basic grant for adults whether they work or not, a child grant, and a wage subsidy to give an extra incentive to those who are just entering the labor market. The three components would be subject to a single, coordinated phase-in/phase-out schedule with no cliffs and with a uniform, moderate benefit reduction rate as participants achieve economic self-sufficiency.
- Fix health care. Health care policy is hard to consolidate or cash out because costly preexisting conditions and unpredictable needs for acute care correlate only weakly with income. To avoid unwanted impacts on work incentives, we need a health care system that guarantees universal basic coverage to everyone regardless of income or employment status. There is no sense in having separate policies for the poor and the nonpoor. Making the transition across those policies is never easy. It is a special nightmare for people whose irregular incomes move them frequently back and forth across the dividing line between Medicaid and the ACA. Nor does it make any sense to link coverage to employment in a way that creates hardships for job losers and undermines labor mobility.
These principles would not have to be implemented all at once, and many could be introduced incrementally. Pandemic-era reforms, including the 2021 expansion of the Child Tax Credit and temporary improvements to income-based ACA premium supports, could serve as models.
But perhaps the most important change would be to persuade policymakers to leave their silos. Whether for helping residents of cold climates with winter heating expenses, improving insurance coverage for chronic health conditions, or facilitating employment for the disabled, each policy is devised with little attention to how such seemingly disparate policies can create unintended consequences for the others. An analysis of the interactions of any new program with existing programs should be as routine an exercise as an environmental impact statement is for a new infrastructure project.
[1] The Atlanta Fed’s calculator is a work in progress. Figure 1 reflects data from the site as of April 2022. The calculator is continually being updated and refined to include more programs and to more accurately represent programs like TANF that vary widely from state to state. It is possible that readers may get somewhat different results if they attempt to reproduce Figure 1 at a later date or from different sources.
[2] Similar charts on the Atlanta Fed site have a different vertical axis, net family resources, which is defined as net family income minus an estimate of the cost of providing basic needs for the family and location in question. The Atlanta Fed’s budget for basic needs is significantly higher than the federal poverty level.