
Introduction and purpose
Electric transmission is essential to maintaining grid reliability1 while meeting growing electricity demand,2 connecting new generation and storage to the grid,3 and advancing affordability by relieving congestion.4 Federal permitting is cited as a challenge to the development of energy infrastructure and, in particular, electric transmission lines.5,6,7 New transmission lines that constitute a major federal action with significant effects on the environment are subject to the preparation and review of Environmental Impact Statements (EIS), the most thorough environmental review required under the National Environmental Policy Act (NEPA). The recent debate over the need for electric transmission permitting reform reveals uncertainties about how federal permitting impacts the ability to add new transmission lines to the bulk power system in the United States. To better inform policy debates about a topic critical to maintaining a reliable, affordable grid, this report comprehensively assesses how federal permitting impacted new transmission lines added to the U.S. bulk power system from 2010 to 2020.
A patchwork of entities plan, develop, and oversee the construction of electric transmission infrastructure across the U.S. The lack of centralized data, access restrictions, and the heterogeneity of the data units (e.g., miles, circuit-miles, megawatt-miles) inhibits policymakers’ ability to fully understand and characterize the landscape of the U.S. transmission system. Likewise, there is not a comprehensive source for federal permitting data. Scarcity of accessible data means policymakers and advocates must often rely on anecdotal examples of electric transmission permitting as evidence.
The report summarizes trends in transmission development, comparing projects that underwent an EIS to all transmission projects in the bulk power system. This analysis uses two distinct datasets and focuses on the period from 2010 to 2020. The first dataset includes 947 new transmission lines added to the bulk power system in the U.S. that came into service between 2010 and 2020 (referred to as the “New Lines dataset”). The second dataset includes an inventory of 37 electric transmission lines in the bulk power system that were in an active federal EIS process between 2010 and 2020 (referred to as the “EIS Lines dataset”). Finally, we contextualize our findings with planned and projected future transmission needs.
Our findings suggest that federal environmental reviews are more likely to be required for long-distance transmission lines that interconnect new generation and increase reliability. Permitting review timelines average 4.3 years, ranging from a minimum of 1 year to a maximum of 11 years.8 Projected growth in transmission, coupled with increased federal funding and authority, suggest a greater proportion of projects will undergo a federal permitting process. These findings underscore the need for a comprehensive review of current permitting processes to promote the development of electric transmission infrastructure, crucial for delivering reliable, affordable, and low-carbon electricity.
Key findings
Proportion of projects with an EIS
Although projects requiring an EIS make up a small proportion of the total number of new transmission lines in the country, they represent a significant proportion of all new line miles. This analysis identified 37 transmission projects with an EIS in progress or completed between 2010 and 2020. Four of these projects were eventually canceled and are not included in the data analysis. The remaining 33 projects represent 3.5% of all new transmission lines but 26% of all new line miles added to the bulk power system during that decade. In this report, the term “transmission lines” refers to individual projects. Some projects were constructed in segments at different points in time, so we treated each segment as an individual transmission line within the data.
Project drivers
Transmission lines are built to advance multiple objectives. Our New Lines dataset indicates a leading project driver for each transmission line, including generation (both renewable and nonrenewable), load growth, asset renewal, and reliability. This distinction was made by The C Three Group, a research and consulting firm whose data was used for this analysis.9
The three most common drivers for all new transmission lines in the bulk power system were reliability (51%), renewable and nonrenewable generation (26%), and load growth (19%). Lines built to interconnect renewable generation accounted for 22% of all new lines.
New lines built for load growth and system capacity needs saw the greatest growth over the decade (see Figure 1 below). New lines built for reliability needs accounted for the largest share of all new line miles, at 38%. 10
Lines built to connect generation to the grid were more likely to require an EIS than other lines, accounting for 61% of lines with an EIS but only 26% of new lines in the bulk power system.
Figure 1: Transmission Line Miles That Came Into Service Each Year, by Project Type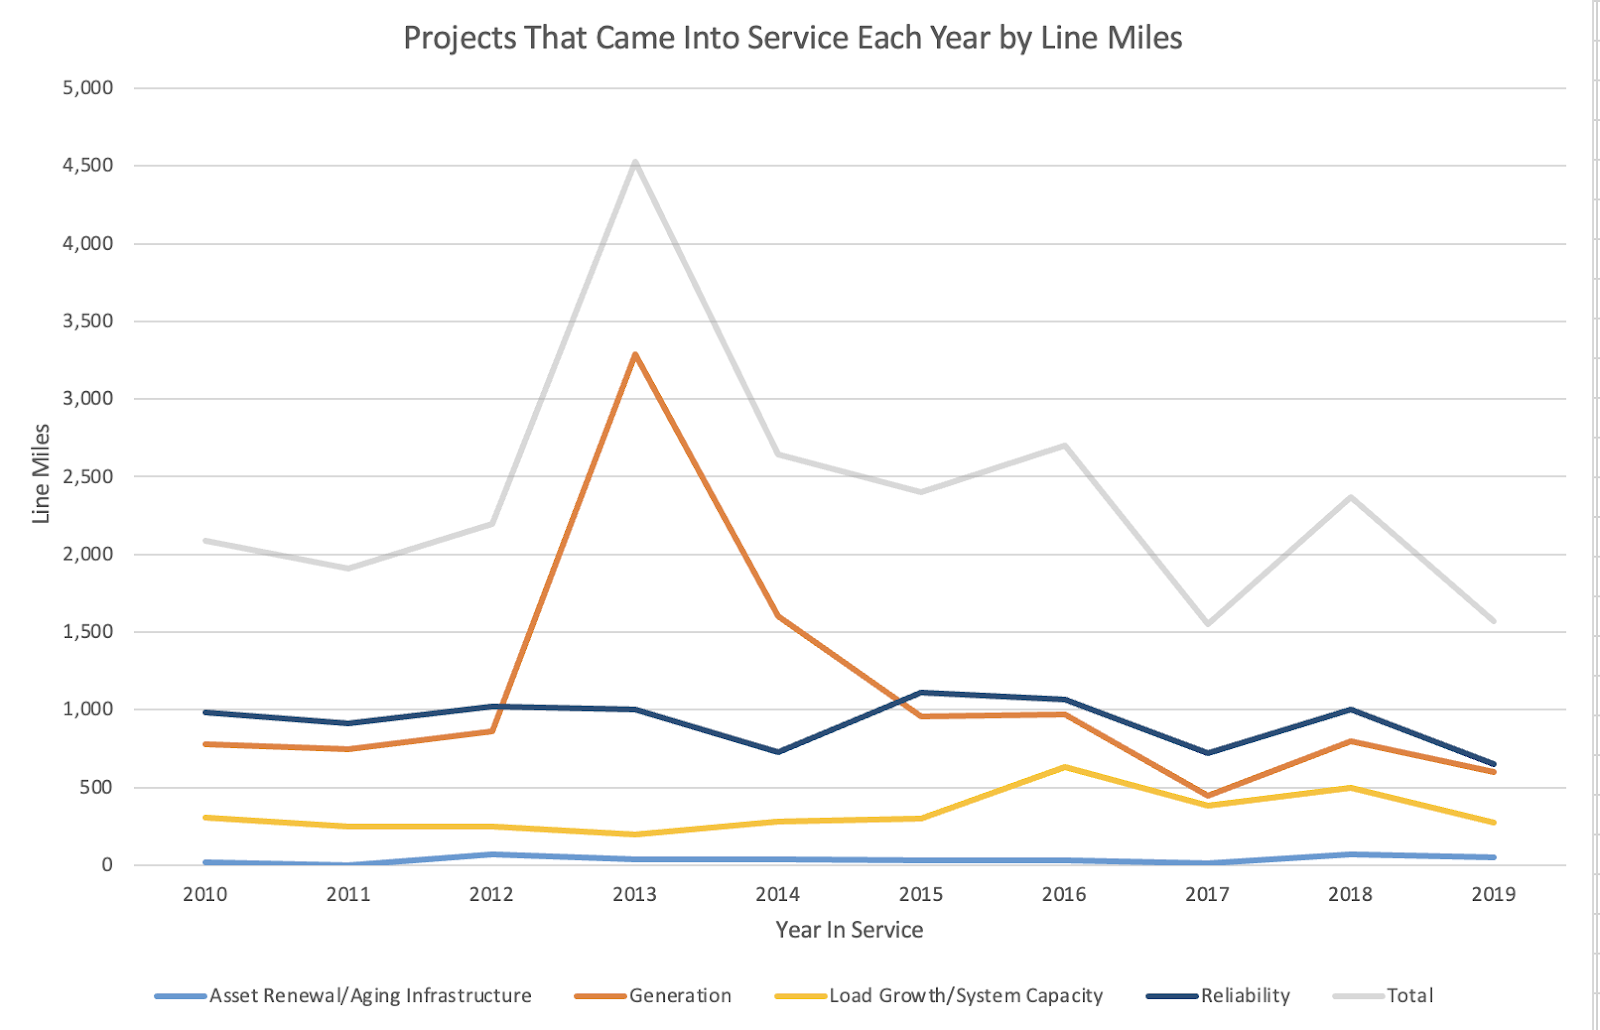
Line length
Transmission lines that required an EIS had an average line length of 192 miles and a median of 144 miles — significantly longer than the length of all new lines in the bulk power system, an average of 26 miles and a median of 15 miles. This indicates that projects that require federal permitting were more than seven times longer in length than the average transmission project.
New lines built to interconnect renewable generation to the grid had the longest average line length of the different transmission project types. This is true for both all new lines (51 miles) and those that require an EIS (277 miles). The average line length for projects built to interconnect renewable generation to the grid was more than double the average for reliability and load growth drivers. The median line lengths similarly reveal that lines driven by interconnection of renewable generation are twice the length of reliability-driven projects and three times the length of lines driven by load growth. Lines built to interconnect renewable generation to the grid accounted for 41% of all new line miles despite accounting for only 22% of all new lines. For comparison, projects connecting nonrenewable generation to the grid accounted for similar shares of new line miles (4.3%) and new lines (3.9%).
Triggers for NEPA review
In addition to providing information on how many projects require a NEPA EIS, this analysis also provides more context into what triggers the need for an EIS review. NEPA applies to a project when a major federal action is taken. Some projects may only be required to complete an environmental assessment (EA), but those that are anticipated to significantly affect the environment require an EIS. Projects in our dataset triggered a NEPA EIS because they crossed public land, were planned by a federal power marketing administration, received federal funding, or required a Clean Water Act Permit.
The two most common major federal actions that triggered a NEPA review consisted of projects that crossed federal land or had federal involvement in project funding. In some cases, projects can trigger NEPA for more than one reason (i.e. the project crosses federal land and is planned by a power marketing administration). For specific NEPA triggers for each project in our dataset, see Table A in the appendix.
Geography
Of all new lines added to the bulk power system, 54 out of 947 (5.5%) crossed state or international borders while 15 out of 33 lines (45%) requiring an EIS crossed state or international borders. This illustrates that a much higher share of EIS lines crossed a border compared to the overall percentage of new transmission lines.
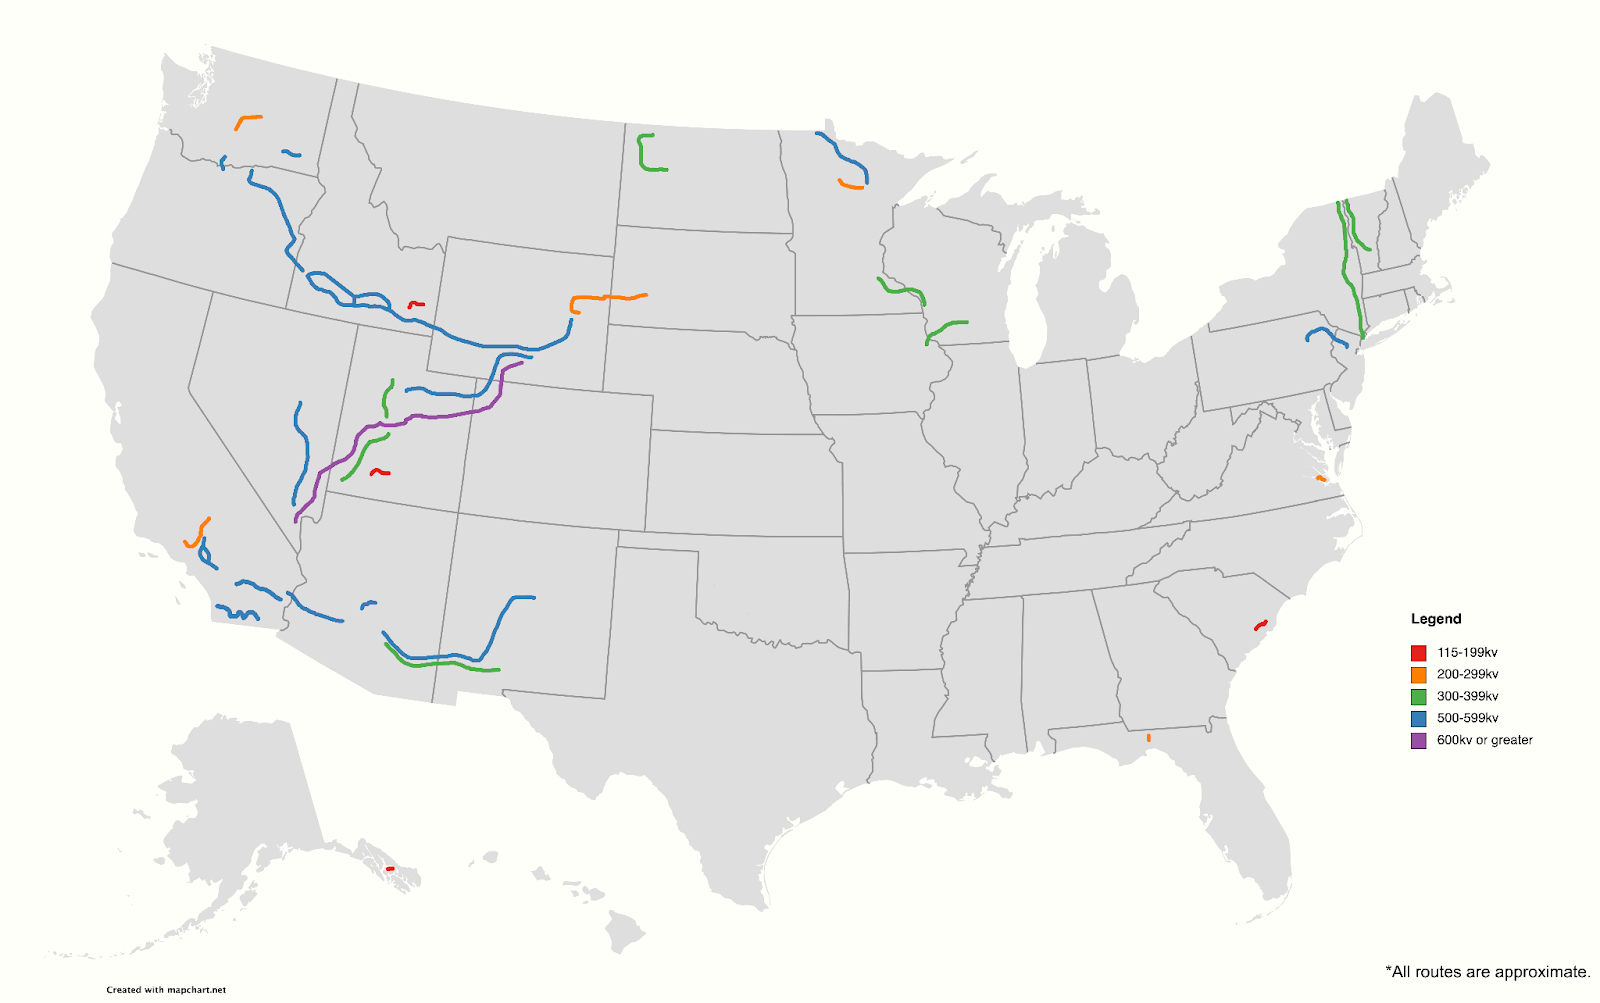
Notably, 21 of the 33 (64%) projects requiring an EIS were built within the California Independent System Operator (CAISO)’s region or the non-RTO West. The region has a much larger share of projects that require an EIS compared to its share of all new lines added to the bulk power system across the U.S., which is only 12%.
Figure 2: Map of the 33 lines in the EIS Lines dataset (excluding 4 of 37 which were canceled)
Timeline for EIS Review
EIS reviews across all electric transmission projects in our database took an average of 4.3 years, with a median of 3.7 years and a range stretching from 1 to 11 years (see Figure 3 below). This timeframe begins at the Notice of Intent (NOI), when the EIS review for a project is publicly announced and concludes once a project has a Record of Decision (ROD), when the final decision and explanation for the decision are published alongside commitments for actions that avoid or mitigate environmental impacts. The Center for Growth and Opportunity at Utah State similarly found that solar, hydropower, wind, and nuclear projects that began the EIS process between 2009 and 2022 had an average time of 3 years between the NOI and ROD.11 Functionally, the permitting process begins well before the NOI, when project proponents undertake planning, outreach, and analysis needed to file for a permit application. The timing of these pre-application portions of the permitting process are opaque and rarely made public, and are therefore not reported here.
Figure 3: Time to Complete NEPA EIS Review (NOI to ROD)

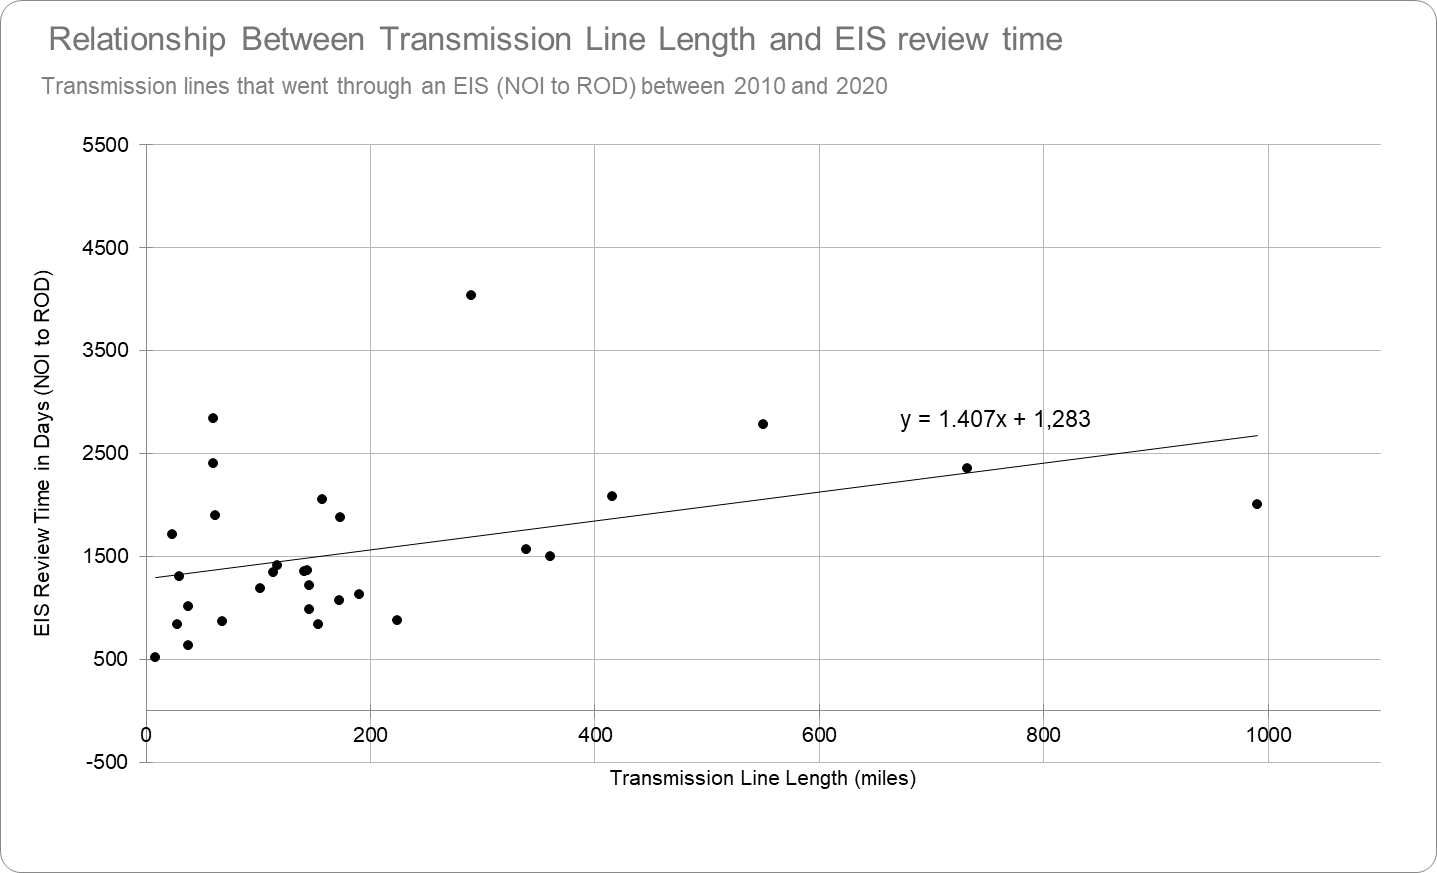
We find that there is a moderate relationship between the length of transmission lines and their respective timelines for an EIS review. Figure 4 below illustrates how increases in transmission line length correlate with non-trivial increases in EIS review times. The trend line indicates that an increase of 100 miles in the length of transmission lines leads to a nearly 5-month increase in EIS review timelines. Furthermore, the Pearson correlation coefficient is 0.41 positive and moderate, indicating that changes in review length lead to changes in transmission line length but do not fully explain changes in EIS review timelines. This suggests that characteristics other than line length impact the time it takes to complete an EIS review.
Figure 4: Relationship Between Transmission Line Length and EIS Review Time
Discussion and conclusion
Our findings show federal environmental reviews are more likely to apply to long-distance lines, roughly 200 miles or greater in length, that are built to interconnect new generation and promote reliability. Only a small fraction, 3.5%, of newly built electric transmission lines that required an EIS make up the number of transmission lines that were built. However, they make up a proportionally larger share, 26%, of total new line miles. Contextualizing these findings within projections of national transmission system growth and triggers for federal permitting is necessary to assess the implications of past federal permitting trends for future transmission development.
Projections for future transmission needs vary widely based on the models used and their input assumptions, such as load growth and clean energy deployment. According to a meta-analysis performed by the Department of Energy, the median projected increase in transmission capacity for 2040 ranged from 22% to 143% for intraregional lines and from 40% to 643% for interregional relative to 2020. Although projections vary widely due to uncertainties about the future, the range of projections for transmission capacity growth dwarf historical figures. Between 2010 to 2020, electricity capacity grew by 7%, load growth was relatively flat,12 and transmission expansion occurred at a rate of 1%.13
Long and unpredictable federal permitting processes hindered the timely development of electric transmission infrastructure historically, and pose a challenge to future growth. Our analysis found that preparing an EIS disproportionately affected interstate lines, lines in the Western U.S., and took an average of 4.3 years to complete, with a range of 1 to 11 years. Faster and more predictable federal permitting timelines are expected to play an important role in accelerating transmission development timelines, particularly in the Western U.S. and on interstate projects. This study identified the two most common triggers for an EIS review to be crossing federal land or federal involvement in federal project funding. With the additional federal funding programs for transmission from the bipartisan Infrastructure Investment and Jobs Act and the Inflation Reduction Act, and the expanded federal siting authority under National Interest Electric Transmission Corridors, an increase in the number of projects that require an EIS due to federal involvement is anticipated.14
Projected future transmission needs and increased federal funding and authority for developing electric transmission lines suggest that federal permitting may be required for a larger share of future development than our analysis revealed for the 2010 to 2020 period. While transmission system capacity can be increased by optimizing existing infrastructure with grid-enhancing technologies15 and reconductoring lines with innovative technologies, building new transmission lines will also be necessary. The long and unpredictable federal permitting timelines for electric transmission observed historically pose a significant challenge to maintaining future grid reliability in the face of growing demand and ambitious decarbonization goals.
Data and methodology
New lines dataset
The “New Lines dataset” is a subset of data on electric transmission infrastructure projects across North America obtained from the C Three Group, an energy infrastructure and utility market research and consulting firm.16 The dataset provides a comprehensive catalog of transmission projects with information on their ownership, location, development status, voltage, project drivers, and other technical information. We chose to exclude lines shorter than 5 miles and/or below 115kV because we wanted to focus on transmission lines and not distribution lines. While there is no bright line threshold, the bulk power system is typically at voltages at or above 115 kV.17 For the purposes of this analysis, we filtered the dataset based on the following criteria:
- Completed and in-service new lines only (excludes rebuilds and upgrades)
- In-service between 2010-2020
- Voltage: 115 kV or greater
- Mileage: 5 miles or greater
- At least one domestic endpoint
Figure 5: New Lines by Voltage Class
| Voltage (kV) | Number of Projects | Percent of Projects |
| 100-199 | 522 | 55% |
| 200-299 | 176 | 19% |
| 300-399 | 208 | 22% |
| 500+ | 41 | 4% |
| Total | 947 | 100% |
The “New Lines dataset” subset contains 947 projects with a combined 24,542 line miles. These projects reflect new transmission lines on the bulk power system that were developed from 2010 up to 2020.
Projects in the dataset were identified by the C Three Group as having a main driver behind the need for the project. Where multiple drivers were identified, the C Three team made an informed decision based on the most commonly cited reason as to which most influenced the need for the project. Drivers include reliability, load growth, generation (renewable, nonrenewable, or unknown), generation deactivation, asset renewal, storm or fire hardening, economics/congestion, public policy, and others.
EIS lines dataset
Our EIS Lines dataset contains electric transmission lines that had an EIS in progress or completed an EIS in the 2010-2020 period. This data was compiled from several sources, including federal databases, academic studies, and publicly available inventories. From our research, we identified 83 electric transmission line projects that had an EIS in progress or completed. These lines were cataloged, assessed, and reviewed thoroughly based on available sources and prior literature.
Because there is no centralized database, we can not definitively state that our dataset represents all electric transmission projects that meet our criteria with an EIS in progress or completed; some eligible lines may have been inadvertently excluded.
Of the 83 lines identified and documented, 37 lines fit the following criteria that aligned with the New Lines dataset. Four of these lines were eventually canceled and were excluded from our analysis. The remaining 33 lines were included in our analysis:
- New lines only (excludes rebuilds and upgrades)18
- Federal Review Status: Projects that had an EIS in progress or completed between 2010 and 2020 (meaning the project published an NOI, FEIS, ROD, or was in the process of having an EIS prepared at some point during the decade).19
- Voltage: 115 kV or greater
- Mileage: 5 miles or greater
- At least one domestic endpoint
Limitations
The datasets utilized in this report were developed through exhaustive research efforts that sought to find and document information on new transmission lines in the bulk power system that were built and/or had an EIS in progress over a 10-year period. The decentralization of electric transmission information required finding and leveraging numerous sources. We cannot definitively state that these datasets captured all projects and EIS, which implicitly limits our analysis and results.
In drawing comparisons between the two datasets, we recognize the wide differences that exist between the datasets, including sourcing, categorization of lines, and scoping criteria. Our comparisons are meant to provide an indication of the proportion of transmission projects that require an EIS, and of the characteristics of those EIS projects relative to a broader set of new transmission lines added to the bulk power system.
With these considerations in mind, we believe our results are important to present and share because our primary goal is to further the public understanding of these complicated processes.]
Appendices
Table A: EIS Lines Dataset
The EIS Lines dataset is a compilation and update of the following sources:
- Moch, Jonathan M. and Henry Lee. “The Challenges of Decarbonizing the U.S. Electric Grid by 2035.” Policy Brief, February 2022.
- Goggin, Michael, Gramlich, Rob and Michael Skelly. ‘Transmission Projects Ready to Go: Plugging into America’s Untapped Renewable Resources’ ACEG, Grid Strategies. 2021.
- Federal Infrastructure Permitting Dashboard: ‘2020 Recommended Performance Schedule Data – Appendix A‘
- Federal Permitting Dashboard
- U.S. Department of Agriculture Rural Utility Service Environmental Impact Statements
- Department of Energy Environmental Impact Statements
- Open EI Transmission NEPA Database
Table A
**Lines with two distinct EIS timelines conducted for 1 transmission project. Total length from EIS NOI to ROD is the combination of both EISs but does not count the time between publication of the first ROD and publication of the second NOI.
***Multiple RODs were published in the EIS process
Acknowledgements
Contributors:
Robin Allen, Gabriel Kaplan, Elvin Choi, Frank Sturges
Reviewers:
Kenneth Sercy, Corey Schrodt, Megan Gibson, Alex Breckel, Nicole Pavia, Annabel Williams, Evan Chapman, Lindsey Griffith, Matthew Mailloux, Cheryl Lombard, Landon Stevens, Chris Tomassi
Data:
The C Three Group
**The views and findings presented in this paper do not reflect the views of the reviewers.
Footnotes
- NERC. (2023). 2023 Long-Term Reliability Assessment. https://www.nerc.com/pa/RAPA/ra/Reliability%20Assessments%20DL/NERC_LTRA_2023.pdf ↩︎
- Wilson, J., & Zimmerman, Z. (2023). The Era of Flat Power Demand is Over. Grid Strategies. lhttps://gridstrategiesllc.com/wp-content/uploads/2023/12/National-Load-Growth-Report-2023.pdf ↩︎
- Lawrence Berkeley National Laboratory. (2023). Queued Up: Characteristics of Power Plants Seeking Transmission Interconnection As of the End of 2022. https://eta-publications.lbl.gov/sites/default/files/queued_up_2022_04-06-2023_0.pdf ↩︎
- Lawrence Berkeley National Laboratory. (2022). Empirical Estimates of Transmission Value using Locational Marginal Prices. https://eta-publications.lbl.gov/sites/default/files/lbnl-empirical_transmission_value_study-august_2022.pdf ↩︎
- Bird, L., & McLaughlin, K. (2023). US Clean Energy Goals Hinge on Faster Permitting. World Resources Institute. https://www.wri.org/insights/clean-energy-permitting-reform-us ↩︎
- Williams, Aime. (2022). Permitting reforms for US infrastructure lay bare energy tensions. Financial Times.https://www.ft.com/content/c8028f4f-7d60-48f7-a269-1e718a7b721f ↩︎
- Moore, Daniel. (2023). Clean Grid Developers See Teeth in Federal Permitting Deadlines. Bloomberg Law. https://news.bloomberglaw.com/environment-and-energy/clean-grid-developers-see-teeth-in-federal-permitting-deadlines ↩︎
- Average and median statistics for permitting review timelines are based on the ‘Publication Date for NOI’ and Publication date of latest ROD’ columns in the dataset (for the 30 transmission lines identified that were not canceled and had both a published NOI and ROD). For those lines with multiple agency RODs, the date the latest ROD published was used to determine the end date of review. Two lines, Sunzia and Tehachapi, had multiple EIS timelines conducted for a single transmission project. In those cases, total review times were calculated by adding together the length of each EIS review period. Time between publication of the first ROD and publication of the second NOI was not included. ↩︎
- See the C Three Group: https://www.cthree.net/ ↩︎
- Notably the spike in transmission developed in 2013 is largely attributable to the Competitive Renewable Energy Zones program in Texas that resulted in the development of roughly 3,600 miles of transmission lines capable of carrying 18,500 MW of electricity;
Powering Texas. (2021). The Importance of Transmission: Bringing Texans More Affordable, Reliable Power. https://www.poweruptexas.org/wp-content/uploads/2021/01/Transmission-Fact-Sheet-Web-Version.pdf ↩︎ - Morales, J., & Rigby, S. (2023). NEPA Timelines for Clean Energy Projects: Understanding Delays in Clean Energy Development. The Center for Growth and Opportunity at Utah State University. https://www.thecgo.org/research/nepa-timelines-for-clean-energy-projects-understanding-delays-in-clean-energy-development/ ↩︎
- See: EIA Annual Energy Review https://www.eia.gov/totalenergy/data/annual/; Table 7.6 electricity end-use consumption and Table 8.11b Electric net summer capacity: electric power sector. ↩︎
- Greer, D., King, C., Mendez, A., & Gülen, G. (2019). U.S. Transmission Miles in relation to Electricity Generation, Peak Power, and Number of Customers. Energy Institute, The University of Texas at Austin. https://energy.utexas.edu/sites/default/files/UTAustin_EIoF_Transmission_2019-02-21.pdf ↩︎
- Quinlan, P., & Schaff, H. (2023). Federal Policy Supports New Transmission, But Will it be Enough? T&D World. https://www.tdworld.com/overhead-transmission/article/21259460/federal-policy-supports-new-transmission-but-will-it-be-enough ↩︎
- U.S. Department of Energy. (2022). Grid-Enhancing Technologies: A Case Study on Ratepayer Impact. https://www.energy.gov/sites/default/files/2022-04/Grid%20Enhancing%20Technologies%20-%20A%20Case%20Study%20on%20Ratepayer%20Impact%20-%20February%202022%20CLEAN%20as%20of%20032322.pdf ↩︎
- See the C Three Group: https://www.cthree.net/ ↩︎
- NERC. (2023). Understanding the Grid. https://www.nerc.com/news/Documents/March%202023%20Understanding%20the%20Grid.pdf ↩︎
- To focus on single electric transmission lines and avoid complicated multipurpose projects that might have been influenced by factors unrelated to transmission, we eliminated any projects that primarily consisted of maintenance, interconnection (generation-tie lines) projects, transmission line rebuilds, or those that were ancillary to other federal projects. Transmission infrastructure projects that were canceled were not included. ↩︎
- Environmental Assessments (EAs), a less complex review, were not included due to the limited nature of this research project and the fact that the most relevant relevant lines (long distance, high-capacity, interstate projects) were more likely to to have undergone an EIS review than a EA). ↩︎