The Census Bureau next week will release its poverty estimates for 2022, a year that featured surging inflation, a rapidly recovering labor market, and an end to most pandemic-era income support. The last three Census poverty reports were notable for each pointing to record-low poverty rates. This year’s report is bound to be notable for different reasons: the Supplemental Poverty Measure (SPM) rate is likely to have increased sharply from 2021 to 2022, while the Official Poverty Measure (OPM) rate may have shown little change or even a decline. Meanwhile, higher living costs and declining income support are likely to compete for space in public narratives about these trends.
To help navigate the potentially-conflicting poverty numbers, and the competing factors driving them, I highlight three storylines that are likely to be central to the Census Bureau’s upcoming findings.
The SPM poverty rate is set for a dramatic increase
The SPM child poverty rate may double from its 2021 level, and yet SPM poverty rates may still be among the lowest in recent U.S. history.
Despite the large increase in unemployment from 2019 to 2020, the poverty rate according to the SPM – a measure that most poverty researchers prefer because it more comprehensively measures income than the OPM – fell from 11.8 percent to 9.1 percent, largely due to the CARES Act’s stimulus checks and expanded unemployment benefits. In 2021, the SPM poverty rate fell again to 7.8 percent, a drop attributable to the expanded Child Tax Credit, another stimulus check, SNAP benefit increases, and more passed within the American Rescue Plan Act (ARP). The extra income support more than offset the higher unemployment rates to achieve low levels of poverty.
What can we expect for 2022? Most of the pandemic-era aid had expired by the start of the year: While SNAP (or “food stamp”) benefit top-ups persisted throughout much of 2022, the American welfare state had largely returned to its 2019 form. At the same time, the unemployment rate recovered to pre-crisis levels, ensuring that market earnings alone could lift more households out of poverty. Based on the 3.6 percent average annual unemployment rate alone, pre-pandemic history (that is, other years during which the CARES Act and ARP were not around) suggests that the overall 2022 SPM rate could land around 12 percent (see Figure 1). If remotely close, this would mark a notable increase in poverty from 2021, yet would still be one of the lowest poverty rates since 1970 thanks to the low unemployment rate (and sufficiently high labor force participation rate).
Figure 1: Except in 2020 and 2021, the average annual unemployment rate is a strong predictor of the SPM poverty rate
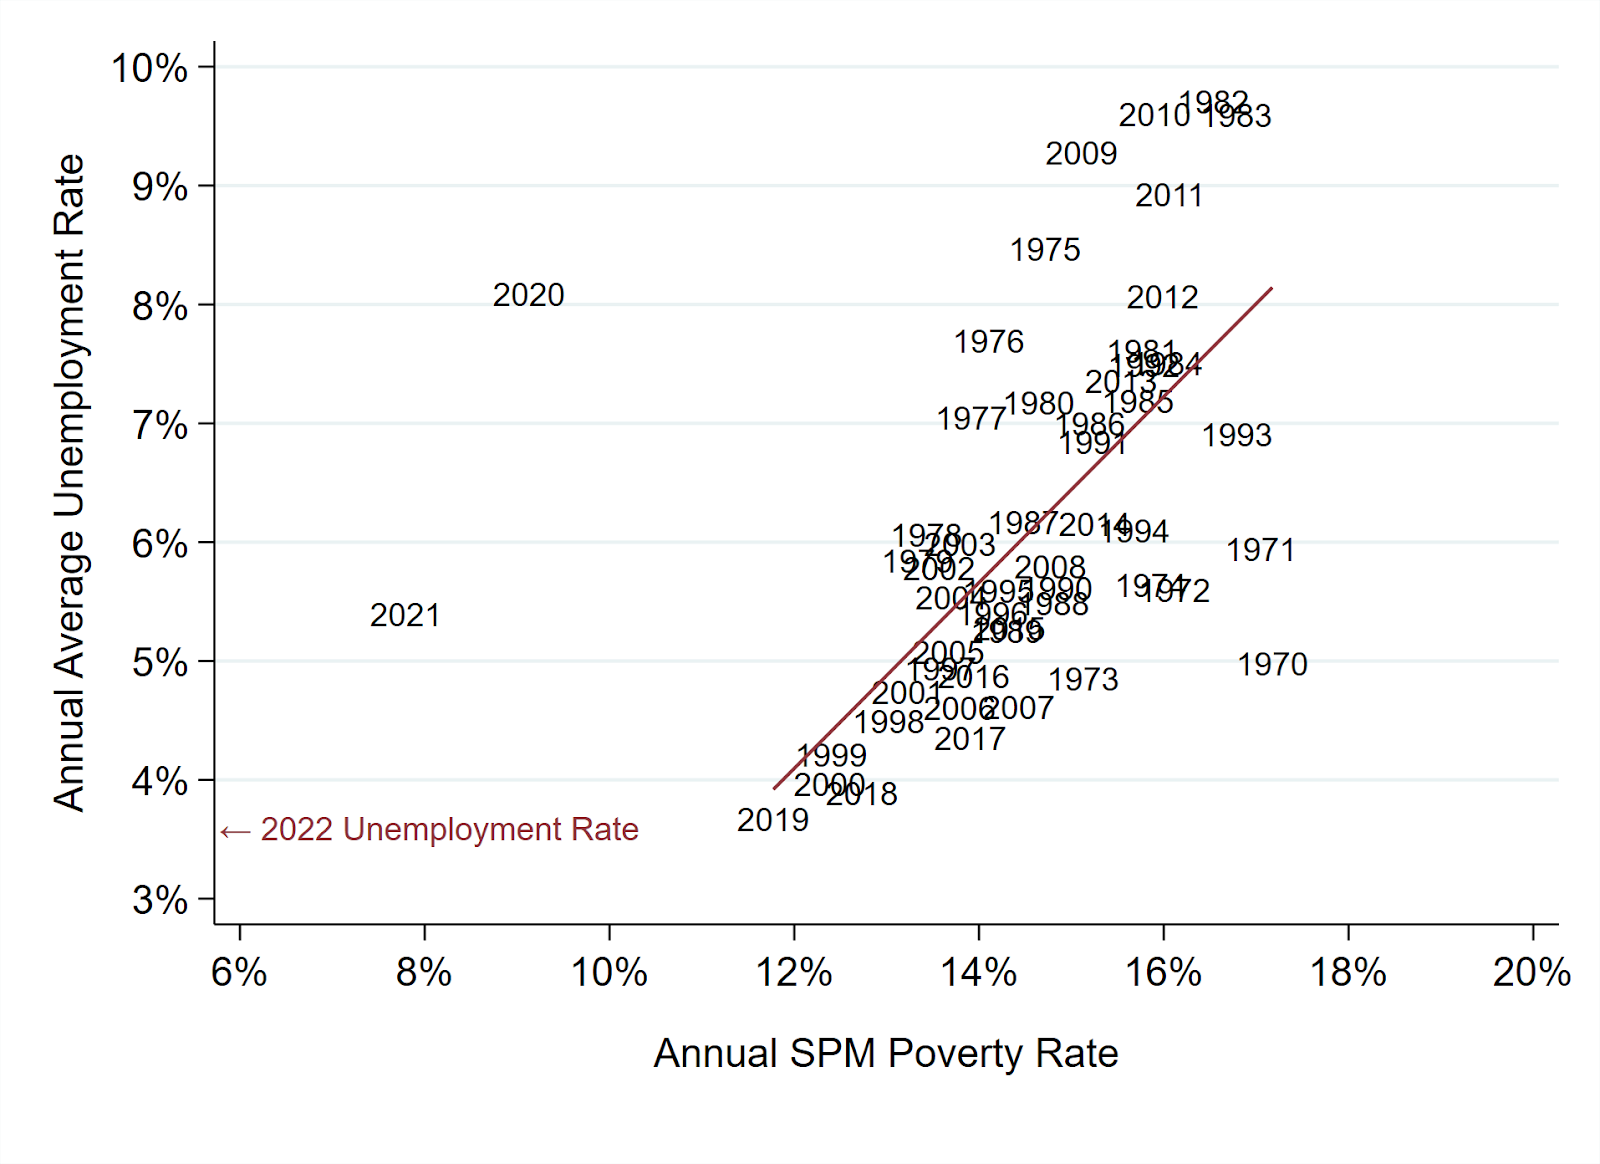
Note: Figure adapted from Chapter 5 of Poverty in the Pandemic: Policy Lessons from COVID-19. The historical SPM poverty rates use standard (non-anchored) thresholds and are from Wimer et al. (2016). The annual unemployment rates are from FRED.
Even if low by historical standards, though, the rising poverty rate would mark a disappointing break from the progress of recent years. This is especially true for child poverty: Due to government income support, the child poverty rate in 2021 was roughly half of its 2020 rate and less than one-third of its rate during the Great Recession a decade before. The expanded Child Tax Credit that contributed most to those gains is now gone; as a result, it is well possible that the SPM child poverty rate could climb from 5.2 percent (its 2021 rate) back near its 2019 rate of 12.5 percent — more than a doubling of the child poverty rate, if it comes to pass.
The change in the OPM poverty rate will tell a very different – and very incomplete – story
While the SPM poverty rate is headed toward a major increase, the OPM rate may change very little, and may even decline. The primary reason for the discordance is the incomplete income definition that the OPM uses: Its ‘money income’ definition excludes most of the major income support programs expanded in recent years, including the CTC, Earned Income Tax Credit, SNAP benefits, and the 2021 stimulus check. As a result, the OPM income definition was likely more incomplete (in terms of excluding important government transfers) in 2021 than in any other year in recent history.
Given its incomplete income measure, any changes in the OPM poverty rate should be given less weight than trends in the SPM poverty rate. The labor market recovery of 2022 portends a potential decline in the OPM rate, though two countervailing forces may inhibit that decrease. The first is the expiration of pandemic-era expansions to the generosity and accessibility of unemployment benefits; available for much of 2021, the programs had fully ended by the start of 2022 and are included in the OPM income definition. The second is inflation.
Rising inflation will influence changing poverty rates, but its role will likely be minor compared to declining income transfers
Inflation largely dominated the economic conversation of 2022, but how and to what extent will it affect the 2022 poverty rates? Inflation will most directly be observed in the SPM and OPM thresholds. As goods and services become more expensive, the minimum level of income needed to avoid being in poverty also rises; thus, if real incomes do not keep up with inflation, the poverty rate can increase.
The OPM thresholds straightforwardly adjust for the Consumer Price Index (CPI-U) each year, leading to an 8 percent increase in the OPM poverty thresholds from 2021 to 2022. For context, the official poverty line for a two-parent, two-child family was $29,678 in 2022, up from $27,479 in 2021 and from $25,926 in 2019. The SPM more indirectly accounts for inflation: Its thresholds update each year according to family spending (rather than price changes specifically) on food, clothing, shelter, and utilities in recent years. From 2020 to 2021, the average SPM threshold increased at a slightly slower rate than the OPM threshold, and Census will release the SPM threshold levels when it releases its 2022 estimates.
Whether these rising poverty thresholds translate into rising poverty rates is dependent, in part, on whether families’ incomes kept pace with inflation. On average, nominal wage growth among employed adults slightly trailed the inflation rate in 2022; at the same time, more adults were working in 2022 than in 2021. As a result, the OPM could decline despite the higher poverty thresholds.
For the SPM, especially, inflation is bound to have a minor role relative to the end of pandemic-era income transfers. Consider that if we applied an across-the-board 8 percent increase in SPM thresholds in 2021 (without any increase in the real value of incomes, an unrealistic scenario), the 2021 SPM poverty rate would have been 9.2 percent instead of 7.7 percent. Conversely, keeping the thresholds as is but removing income from the monthly CTC payments and stimulus check (to say nothing of other temporary income supports provided in 2021) would have left the poverty rate at 11.2 percent, notably higher. The upshot: The expiration of COVID-era income support, more so than rising inflation, is likely to explain the increase in SPM poverty from 2021 to 2022.
An end to record-low poverty rates
After three consecutive years of record-low SPM poverty rates, Census will announce this week that the streak ended in 2022, and likely in dramatic fashion: A doubling of the SPM child poverty rate is not out of the question. This spike in SPM poverty is likely to occur alongside a much smaller change, and perhaps even a decline, in the OPM rate, but changes in the latter should be understood in context: The OPM’s income definition excludes the vast majority of pandemic-era income support that brought the SPM rate to record-lows. While rising living costs contributed to higher poverty thresholds in 2022, the consequences of inflation for changes in poverty rates are likely to be notably smaller than the disappearance of the ARP’s generous income support.