Initial results from Niskanen Center and Grid Strategies’ Winter Storm Fern report underscore the need for more interregional transmission capacity and new grid resources of all forms to meet rising demand for electricity while keeping prices low. In particular, generator performance varied by region and by fuel type while gas supply constraints and transmission congestion increased costs to consumers. Our full report expands on the results outlined below.
The facts on generator performance
The three hardest-hit grid regions — Southwest Power Pool (SPP), PJM Interconnection (PJM), and the Midcontinent Independent System Operator (MISO) — exhibited similar results in the performance of conventional vs. renewable power. Table 1 below compares the actual output of each fuel type against its accredited capacity. Accredited capacity is how much power a grid operator expects from a generating resource during periods of peak need, compared with the maximum amount of power that a given resource could provide. In regions with a capacity market, this accreditation is also used to determine how and for what a resource gets paid.
Table 1: Output during Winter Storm Fern peak demand compared with accredited capacity1
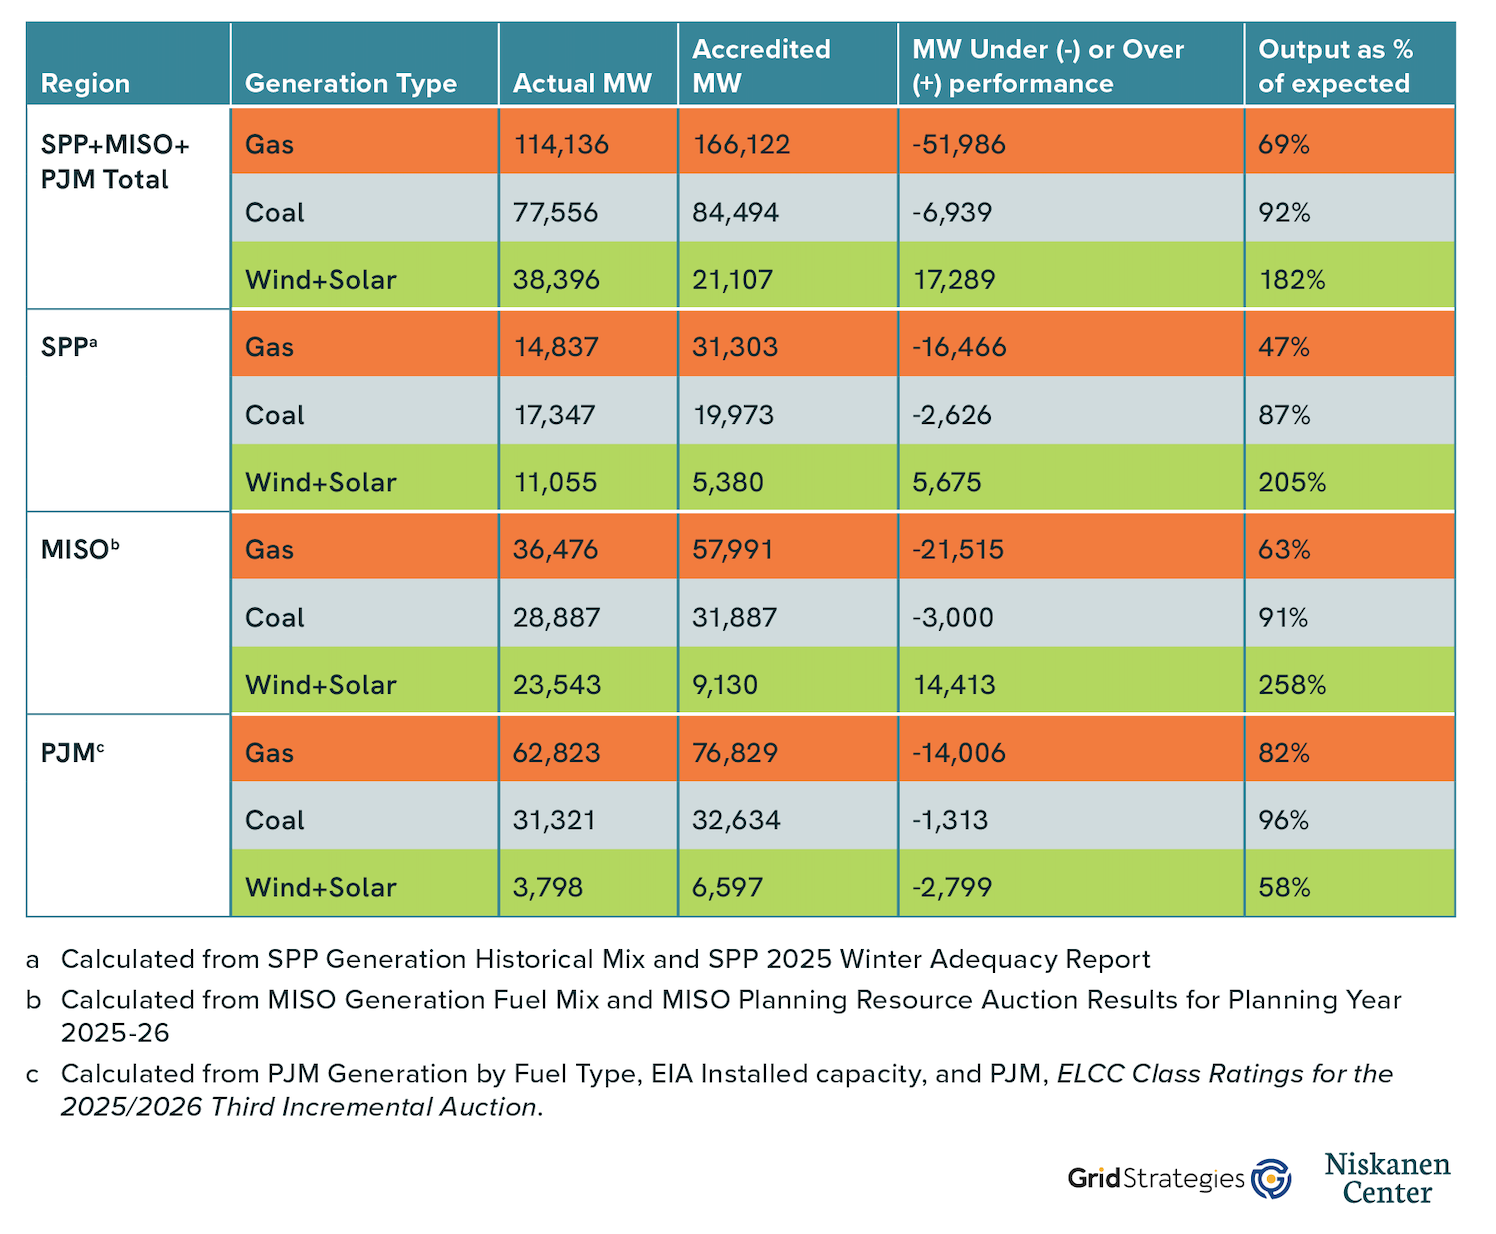
In all three regions, gas-fired power plants performed significantly below expectations, with plants in the Plains region producing less than half of the expected energy output. Generator outages appear to have been the primary reason. Renewable resources, on the other hand, delivered over twice their accredited capacity in both the SPP and MISO regions.
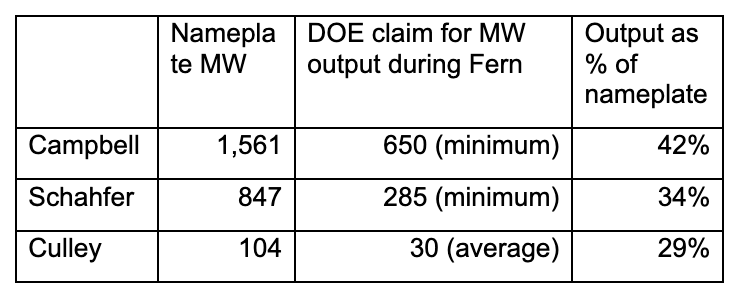
Coal-fired power plants in each region performed close to expectations, with shortfalls of less than 15 percent in all three regions. This overall high performance of this generation type is in stark contrast to the specific coal-fired power plants that Department of Energy emergency orders have unnecessarily kept online for months. Table 2 shows that each of those plants delivered significantly less power than anticipated during the storm.
Table 2: DOE reported performance for MISO coal units that were under DOE mandates
Generator performance affected price
As with Winter Storms Uri and Elliott before it, Fern caused large increases in the price of natural gas, particularly in the East. PJM notes on page 38 of its January Cold Weather Operations Report that “Spot gas prices through this event reached historic levels throughout the Eastern U.S. with many hubs trading well over $100/mmbtu with prices in NY and New England approaching $300/mmbtu.” These prices were 30 to 90 times the average price of gas in 2025.
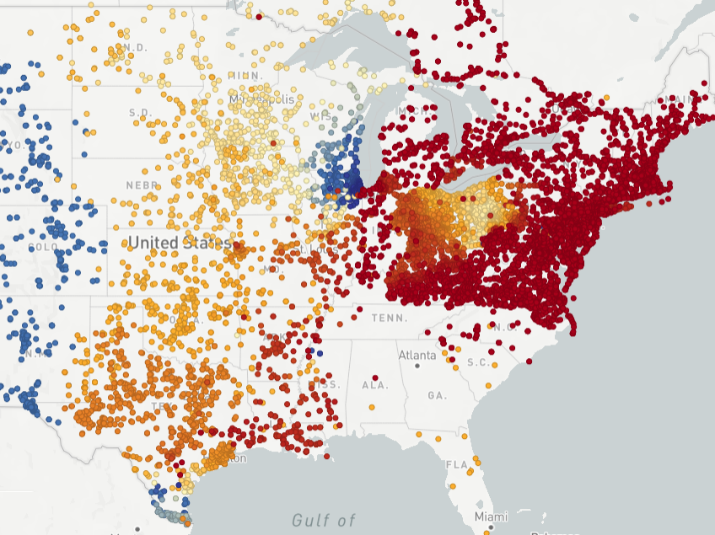
Interregional transmission can smooth these market dynamics and stabilize prices during high-demand events. By strengthening connections between grid regions, transmission allows electricity to flow to areas experiencing shortages from areas with surplus. The longer these transmission lines are, the less likely that the regions at either endpoint will experience the same severe weather at the same time. Figure 1 shows two snapshots from Grid Status’s Nodal Map, illustrating how the price of electricity changed over two days of the storm because the location of the most severe weather moved.
Figure 1: Locational Marginal Pricing (LMP) for power during Winter Storm Fern changed significantly by region and by day
January 23, 2026, 4:30 PM ET
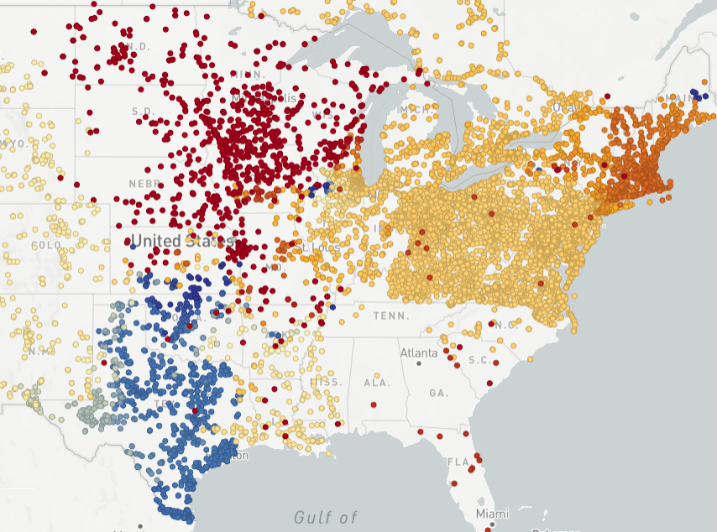
January 25, 2026, 4:30 PM ET
Instead of relying primarily on a narrow set of local generators, susceptible to fuel price volatility and vulnerable to individual generator outages, the system would be able to draw on a much larger and more diverse supply base. In practice, this means that transmission acts as risk management for the grid, reducing the likelihood that localized constraints translate into extreme price volatility.
Strengthening the grid after Winter Storm Fern
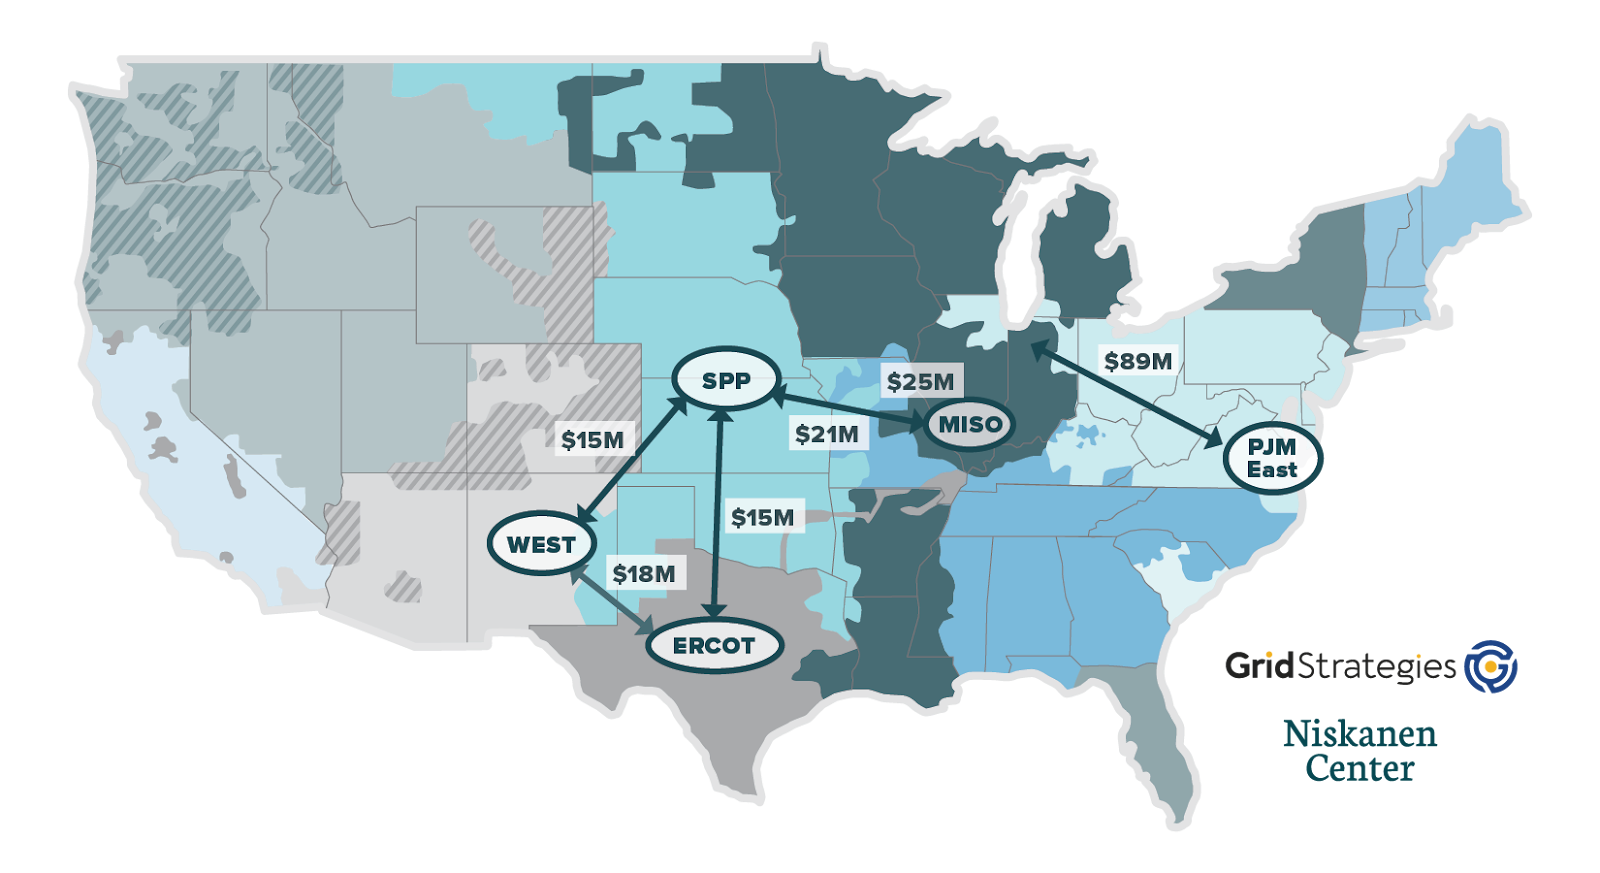
Strengthening the grid’s ability to move power across regions can reduce energy price volatility. Figure 2 shows the value a 1 GW line between different regions would have provided during the three-day storm by moving power from low-price to high-price regions.
Figure 2: Expanding transmission ties by 1 GW between neighboring grid operators could have captured up to $183 Million in value
Long-term transmission planning requirements exist only at the regional level. The Federal Energy Regulatory Commission (FERC) should, of its own accord or under the direction of Congress, establish an interregional planning requirement, or a minimum interregional transfer capacity requirement. FERC’s February report to Congress on the Interregional Transfer Capability Study done by the North American Electric Reliability Corporation (NERC) declined to recommend a capacity requirement. It did so, in part, by noting the study that formed the basis of its report did not include an economic assessment, though many assessments similar to Figure 2 have been published, including by national labs. Economic analysis by Grid Strategies showed that the “prudent additions” identified in the NERC report would be highly beneficial.
FERC should also require markets to standardize consideration of high voltage direct current (HVDC) transmission technology, which is well-suited for long-distance and interregional power transfer. Standardization would facilitate the interconnection of these lines and provide a revenue stream for the capacity and grid-stability services these lines can provide.
Interregion transmission projects take years to complete, though, and are not an immediate solution. In the interim, policymakers should pursue practical “no-regrets” upgrades that increase transfer capability while larger projects are developed. Grid-enhancing technologies, strategically sited batteries, and reconductoring existing lines with advanced conductors can be deployed quickly to increase transfer capability.
A more interconnected and flexible grid would be better positioned to maintain reliability and limit price spikes when the next winter storm hits.
- Data for Table 1 derived as follows:
SPP: Actual generation during peak from https://portal.spp.org/pages/generation-mix-historical, divided by accredited capacity from https://www.spp.org/documents/75520/2025%20spp%20winter%20resource%20adequacy%20report.pdf, at 7
MISO: Actual generation during peak from https://www.misoenergy.org/markets-and-operations/real-time–market-data/market-reports/#nt=/MarketReportType:Summary/MarketReportName:Generation%20Fuel%20Mix%20(xlsx) divided by accredited winter capacity from , https://cdn.misoenergy.org/2025%20PRA%20Results%20Posting%2020250529_Corrections694160.pdf, at 41
PJM: Actual generation during peak from PJM, Generation by Fuel Type, https://dataminer2.pjm.com/feed/gen_by_fuel, divided by January 2026 installed capacity from EIA, Preliminary Monthly Electric Generator Inventory, https://www.eia.gov/electricity/data/eia860m/, times PJM accreditation from PJM, ELCC Class Ratings for the 2025/2026 Third Incremental Auction, https://www.pjm.com/-/media/DotCom/planning/res-adeq/elcc/2025-26-3ia-elcc-class-ratings.pdf ↩︎